Immigrants from Asia vs Italian No Vehicles in Household
COMPARE
Immigrants from Asia
Italian
No Vehicles in Household
No Vehicles in Household Comparison
Immigrants from Asia
Italians
10.9%
NO VEHICLES IN HOUSEHOLD
21.3/ 100
METRIC RATING
199th/ 347
METRIC RANK
8.6%
NO VEHICLES IN HOUSEHOLD
99.4/ 100
METRIC RATING
83rd/ 347
METRIC RANK
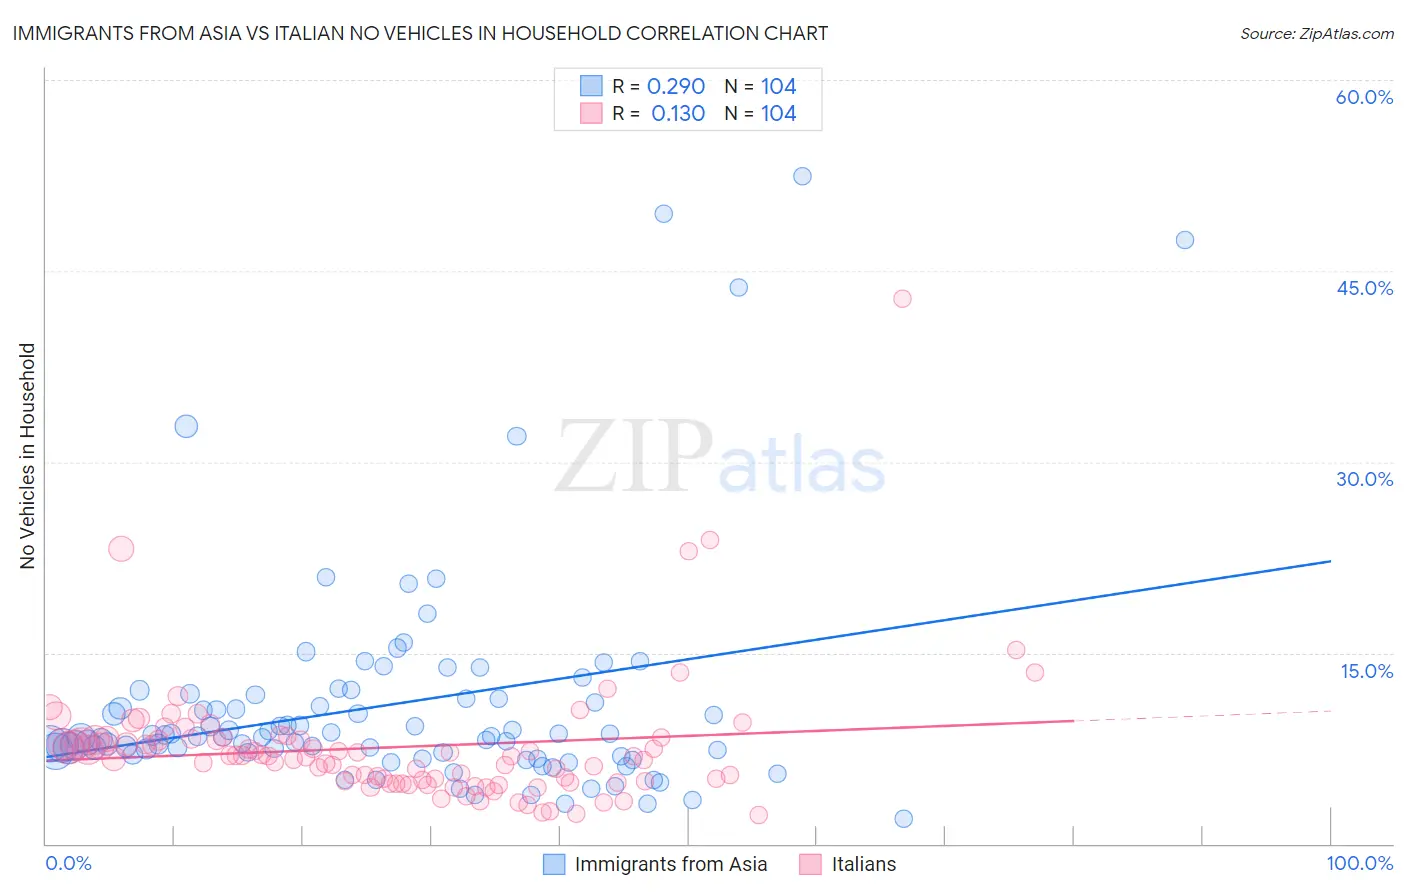
Immigrants from Asia vs Italian No Vehicles in Household Correlation Chart
The statistical analysis conducted on geographies consisting of 545,313,645 people shows a weak positive correlation between the proportion of Immigrants from Asia and percentage of households with no vehicle available in the United States with a correlation coefficient (R) of 0.290 and weighted average of 10.9%. Similarly, the statistical analysis conducted on geographies consisting of 569,049,738 people shows a poor positive correlation between the proportion of Italians and percentage of households with no vehicle available in the United States with a correlation coefficient (R) of 0.130 and weighted average of 8.6%, a difference of 25.9%.
No Vehicles in Household Correlation Summary
| Measurement | Immigrants from Asia | Italian |
| Minimum | 2.0% | 2.3% |
| Maximum | 52.4% | 42.9% |
| Range | 50.5% | 40.6% |
| Mean | 10.9% | 7.6% |
| Median | 8.4% | 6.9% |
| Interquartile 25% (IQ1) | 7.1% | 4.9% |
| Interquartile 75% (IQ3) | 11.4% | 8.2% |
| Interquartile Range (IQR) | 4.3% | 3.3% |
| Standard Deviation (Sample) | 9.0% | 5.1% |
| Standard Deviation (Population) | 8.9% | 5.1% |
Similar Demographics by No Vehicles in Household
Demographics Similar to Immigrants from Asia by No Vehicles in Household
In terms of no vehicles in household, the demographic groups most similar to Immigrants from Asia are Immigrants from Sweden (10.8%, a difference of 0.31%), Cambodian (10.9%, a difference of 0.33%), Immigrants from Western Europe (10.9%, a difference of 0.44%), Shoshone (10.8%, a difference of 0.52%), and Central American (10.8%, a difference of 0.56%).
| Demographics | Rating | Rank | No Vehicles in Household |
| Carpatho Rusyns | 32.1 /100 | #192 | Fair 10.7% |
| Ukrainians | 28.0 /100 | #193 | Fair 10.7% |
| Pueblo | 27.0 /100 | #194 | Fair 10.8% |
| Immigrants | Brazil | 26.3 /100 | #195 | Fair 10.8% |
| Central Americans | 24.3 /100 | #196 | Fair 10.8% |
| Shoshone | 24.1 /100 | #197 | Fair 10.8% |
| Immigrants | Sweden | 22.9 /100 | #198 | Fair 10.8% |
| Immigrants | Asia | 21.3 /100 | #199 | Fair 10.9% |
| Cambodians | 19.6 /100 | #200 | Poor 10.9% |
| Immigrants | Western Europe | 19.1 /100 | #201 | Poor 10.9% |
| Romanians | 17.9 /100 | #202 | Poor 10.9% |
| Iroquois | 17.6 /100 | #203 | Poor 10.9% |
| Guatemalans | 16.1 /100 | #204 | Poor 11.0% |
| Immigrants | Chile | 15.9 /100 | #205 | Poor 11.0% |
| Somalis | 15.9 /100 | #206 | Poor 11.0% |
Demographics Similar to Italians by No Vehicles in Household
In terms of no vehicles in household, the demographic groups most similar to Italians are Immigrants from Jordan (8.7%, a difference of 0.25%), Lebanese (8.7%, a difference of 0.31%), Immigrants from South Eastern Asia (8.6%, a difference of 0.34%), Bangladeshi (8.7%, a difference of 0.41%), and Tsimshian (8.6%, a difference of 0.47%).
| Demographics | Rating | Rank | No Vehicles in Household |
| Immigrants | Philippines | 99.5 /100 | #76 | Exceptional 8.5% |
| Iranians | 99.5 /100 | #77 | Exceptional 8.6% |
| Immigrants | South Central Asia | 99.5 /100 | #78 | Exceptional 8.6% |
| Portuguese | 99.5 /100 | #79 | Exceptional 8.6% |
| Bolivians | 99.4 /100 | #80 | Exceptional 8.6% |
| Tsimshian | 99.4 /100 | #81 | Exceptional 8.6% |
| Immigrants | South Eastern Asia | 99.4 /100 | #82 | Exceptional 8.6% |
| Italians | 99.4 /100 | #83 | Exceptional 8.6% |
| Immigrants | Jordan | 99.3 /100 | #84 | Exceptional 8.7% |
| Lebanese | 99.3 /100 | #85 | Exceptional 8.7% |
| Bangladeshis | 99.3 /100 | #86 | Exceptional 8.7% |
| Immigrants | England | 99.2 /100 | #87 | Exceptional 8.7% |
| Osage | 99.2 /100 | #88 | Exceptional 8.7% |
| Immigrants | Cuba | 99.2 /100 | #89 | Exceptional 8.7% |
| Bhutanese | 99.2 /100 | #90 | Exceptional 8.7% |