Spanish American Indian vs Immigrants from Kazakhstan No Vehicles in Household
COMPARE
Spanish American Indian
Immigrants from Kazakhstan
No Vehicles in Household
No Vehicles in Household Comparison
Spanish American Indians
Immigrants from Kazakhstan
10.1%
NO VEHICLES IN HOUSEHOLD
70.2/ 100
METRIC RATING
158th/ 347
METRIC RANK
13.6%
NO VEHICLES IN HOUSEHOLD
0.0/ 100
METRIC RATING
283rd/ 347
METRIC RANK
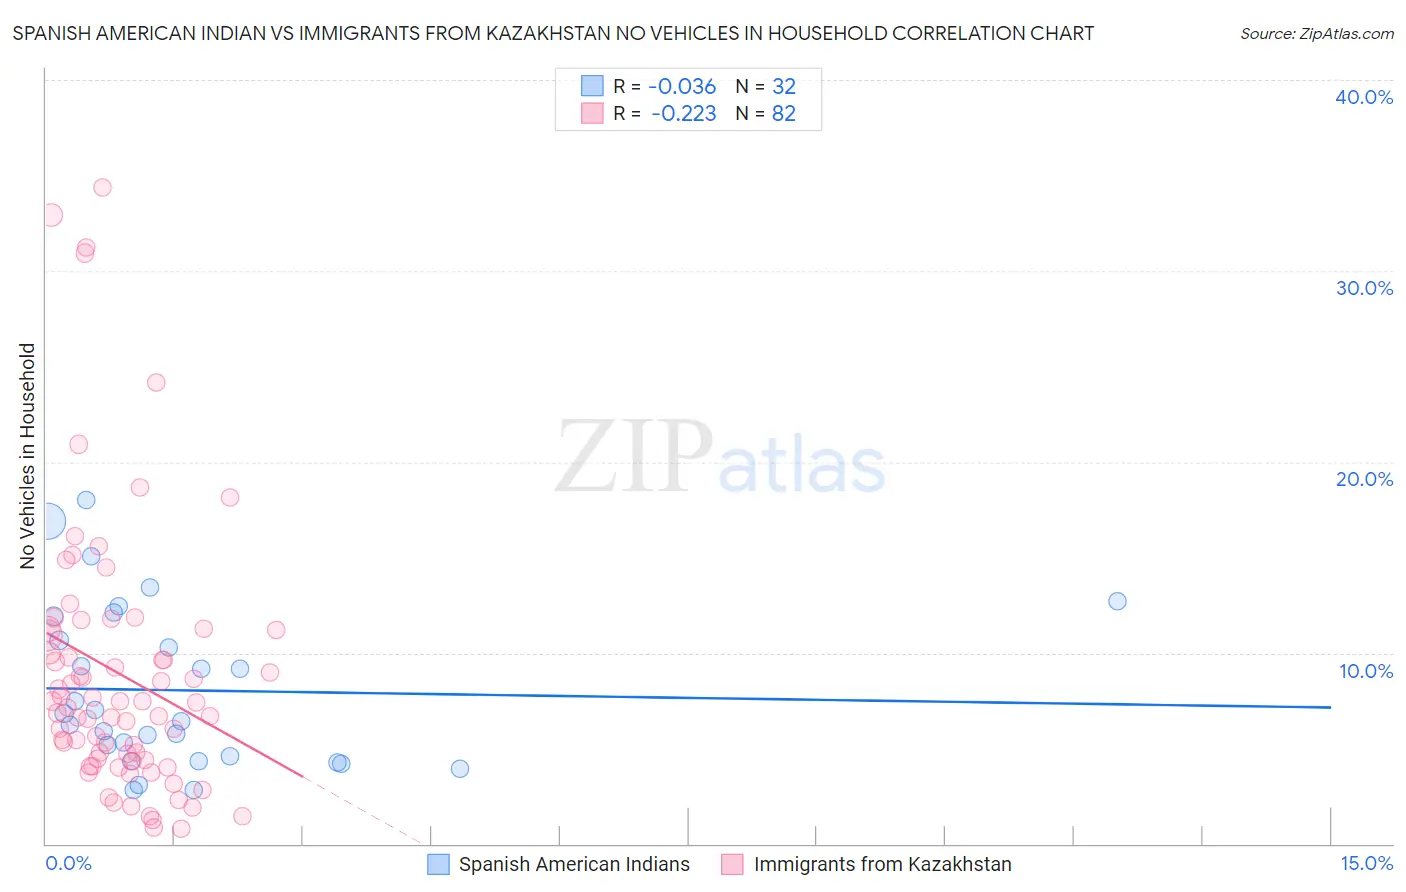
Spanish American Indian vs Immigrants from Kazakhstan No Vehicles in Household Correlation Chart
The statistical analysis conducted on geographies consisting of 73,126,627 people shows no correlation between the proportion of Spanish American Indians and percentage of households with no vehicle available in the United States with a correlation coefficient (R) of -0.036 and weighted average of 10.1%. Similarly, the statistical analysis conducted on geographies consisting of 124,281,418 people shows a weak negative correlation between the proportion of Immigrants from Kazakhstan and percentage of households with no vehicle available in the United States with a correlation coefficient (R) of -0.223 and weighted average of 13.6%, a difference of 34.2%.
No Vehicles in Household Correlation Summary
| Measurement | Spanish American Indian | Immigrants from Kazakhstan |
| Minimum | 2.8% | 0.77% |
| Maximum | 18.0% | 34.4% |
| Range | 15.2% | 33.6% |
| Mean | 8.0% | 8.9% |
| Median | 6.6% | 7.3% |
| Interquartile 25% (IQ1) | 4.4% | 4.4% |
| Interquartile 75% (IQ3) | 11.3% | 11.2% |
| Interquartile Range (IQR) | 6.8% | 6.9% |
| Standard Deviation (Sample) | 4.2% | 7.1% |
| Standard Deviation (Population) | 4.1% | 7.0% |
Similar Demographics by No Vehicles in Household
Demographics Similar to Spanish American Indians by No Vehicles in Household
In terms of no vehicles in household, the demographic groups most similar to Spanish American Indians are Australian (10.1%, a difference of 0.060%), Immigrants from Micronesia (10.1%, a difference of 0.11%), Immigrants from Indonesia (10.1%, a difference of 0.15%), Salvadoran (10.1%, a difference of 0.36%), and Sioux (10.1%, a difference of 0.37%).
| Demographics | Rating | Rank | No Vehicles in Household |
| Immigrants | Eastern Africa | 73.8 /100 | #151 | Good 10.0% |
| Immigrants | Congo | 73.0 /100 | #152 | Good 10.1% |
| Tlingit-Haida | 72.5 /100 | #153 | Good 10.1% |
| Sioux | 72.4 /100 | #154 | Good 10.1% |
| Salvadorans | 72.4 /100 | #155 | Good 10.1% |
| Immigrants | Micronesia | 70.9 /100 | #156 | Good 10.1% |
| Australians | 70.6 /100 | #157 | Good 10.1% |
| Spanish American Indians | 70.2 /100 | #158 | Good 10.1% |
| Immigrants | Indonesia | 69.3 /100 | #159 | Good 10.1% |
| Immigrants | Middle Africa | 65.7 /100 | #160 | Good 10.2% |
| New Zealanders | 65.1 /100 | #161 | Good 10.2% |
| Immigrants | Austria | 64.4 /100 | #162 | Good 10.2% |
| Immigrants | Cambodia | 63.7 /100 | #163 | Good 10.2% |
| South Africans | 61.1 /100 | #164 | Good 10.2% |
| Comanche | 60.8 /100 | #165 | Good 10.2% |
Demographics Similar to Immigrants from Kazakhstan by No Vehicles in Household
In terms of no vehicles in household, the demographic groups most similar to Immigrants from Kazakhstan are Immigrants from Eastern Asia (13.5%, a difference of 0.040%), Immigrants from Malaysia (13.6%, a difference of 0.24%), Immigrants from Eastern Europe (13.6%, a difference of 0.30%), Colville (13.7%, a difference of 0.96%), and Immigrants from Ireland (13.7%, a difference of 1.2%).
| Demographics | Rating | Rank | No Vehicles in Household |
| Immigrants | Southern Europe | 0.1 /100 | #276 | Tragic 13.0% |
| Aleuts | 0.1 /100 | #277 | Tragic 13.0% |
| Immigrants | Croatia | 0.1 /100 | #278 | Tragic 13.0% |
| Mongolians | 0.0 /100 | #279 | Tragic 13.1% |
| Alsatians | 0.0 /100 | #280 | Tragic 13.2% |
| Central American Indians | 0.0 /100 | #281 | Tragic 13.3% |
| Immigrants | Eastern Asia | 0.0 /100 | #282 | Tragic 13.5% |
| Immigrants | Kazakhstan | 0.0 /100 | #283 | Tragic 13.6% |
| Immigrants | Malaysia | 0.0 /100 | #284 | Tragic 13.6% |
| Immigrants | Eastern Europe | 0.0 /100 | #285 | Tragic 13.6% |
| Colville | 0.0 /100 | #286 | Tragic 13.7% |
| Immigrants | Ireland | 0.0 /100 | #287 | Tragic 13.7% |
| Hopi | 0.0 /100 | #288 | Tragic 13.7% |
| Immigrants | Australia | 0.0 /100 | #289 | Tragic 13.8% |
| Indians (Asian) | 0.0 /100 | #290 | Tragic 14.1% |