Alsatian vs Immigrants from Kazakhstan No Vehicles in Household
COMPARE
Alsatian
Immigrants from Kazakhstan
No Vehicles in Household
No Vehicles in Household Comparison
Alsatians
Immigrants from Kazakhstan
13.2%
NO VEHICLES IN HOUSEHOLD
0.0/ 100
METRIC RATING
280th/ 347
METRIC RANK
13.6%
NO VEHICLES IN HOUSEHOLD
0.0/ 100
METRIC RATING
283rd/ 347
METRIC RANK
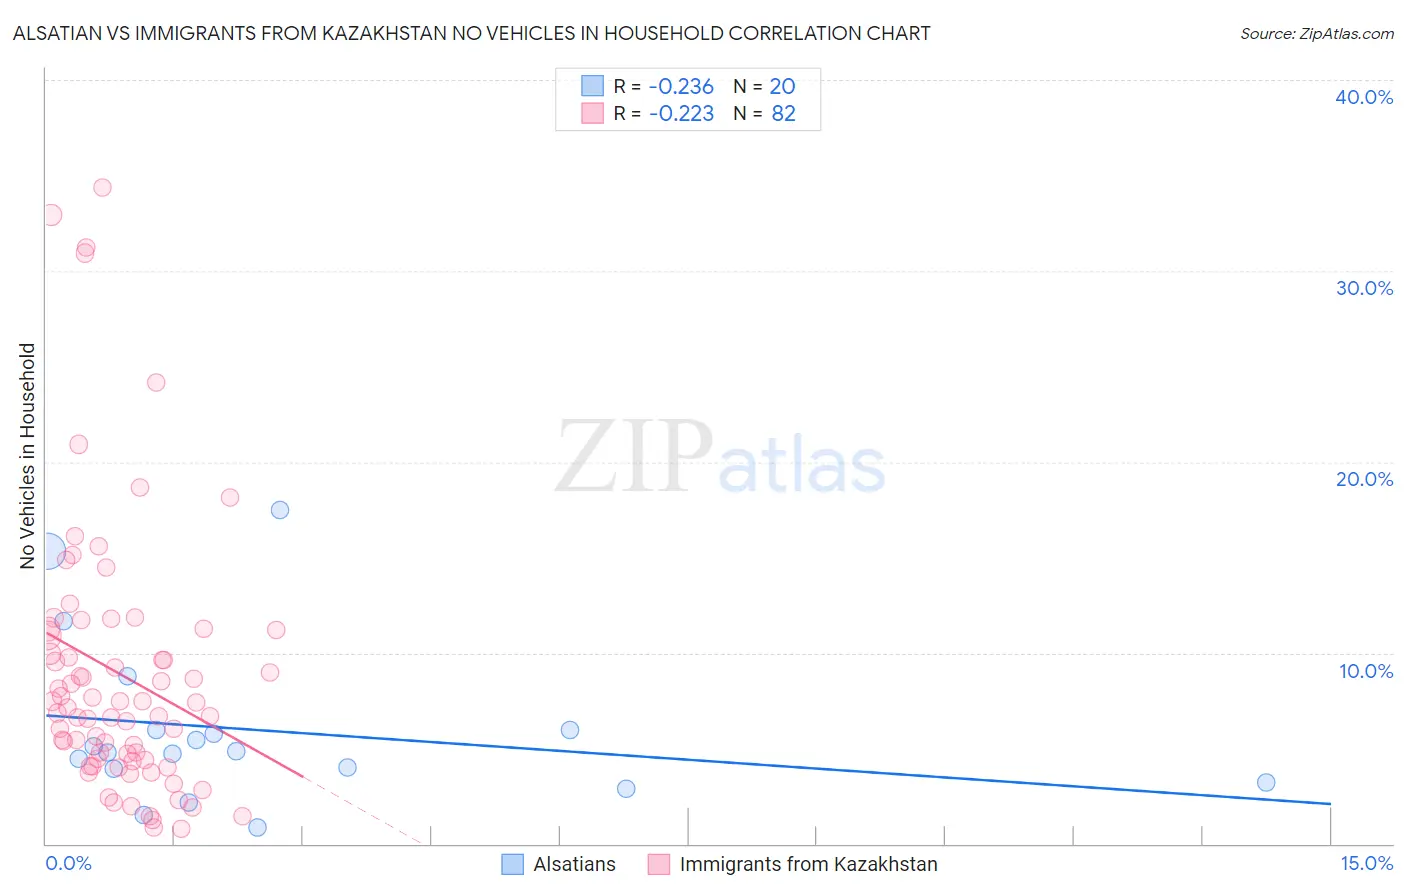
Alsatian vs Immigrants from Kazakhstan No Vehicles in Household Correlation Chart
The statistical analysis conducted on geographies consisting of 82,625,632 people shows a weak negative correlation between the proportion of Alsatians and percentage of households with no vehicle available in the United States with a correlation coefficient (R) of -0.236 and weighted average of 13.2%. Similarly, the statistical analysis conducted on geographies consisting of 124,281,418 people shows a weak negative correlation between the proportion of Immigrants from Kazakhstan and percentage of households with no vehicle available in the United States with a correlation coefficient (R) of -0.223 and weighted average of 13.6%, a difference of 3.0%.
No Vehicles in Household Correlation Summary
| Measurement | Alsatian | Immigrants from Kazakhstan |
| Minimum | 0.84% | 0.77% |
| Maximum | 17.5% | 34.4% |
| Range | 16.6% | 33.6% |
| Mean | 5.9% | 8.9% |
| Median | 4.8% | 7.3% |
| Interquartile 25% (IQ1) | 3.6% | 4.4% |
| Interquartile 75% (IQ3) | 5.9% | 11.2% |
| Interquartile Range (IQR) | 2.4% | 6.9% |
| Standard Deviation (Sample) | 4.3% | 7.1% |
| Standard Deviation (Population) | 4.2% | 7.0% |
Demographics Similar to Alsatians and Immigrants from Kazakhstan by No Vehicles in Household
In terms of no vehicles in household, the demographic groups most similar to Alsatians are Mongolian (13.1%, a difference of 0.27%), Immigrants from Croatia (13.0%, a difference of 0.96%), Aleut (13.0%, a difference of 1.0%), Immigrants from Southern Europe (13.0%, a difference of 1.1%), and Central American Indian (13.3%, a difference of 1.4%). Similarly, the demographic groups most similar to Immigrants from Kazakhstan are Immigrants from Eastern Asia (13.5%, a difference of 0.040%), Immigrants from Malaysia (13.6%, a difference of 0.24%), Immigrants from Eastern Europe (13.6%, a difference of 0.30%), Colville (13.7%, a difference of 0.96%), and Immigrants from Ireland (13.7%, a difference of 1.2%).
| Demographics | Rating | Rank | No Vehicles in Household |
| Immigrants | Morocco | 0.2 /100 | #271 | Tragic 12.6% |
| Bermudans | 0.1 /100 | #272 | Tragic 12.8% |
| Immigrants | France | 0.1 /100 | #273 | Tragic 12.9% |
| Immigrants | Singapore | 0.1 /100 | #274 | Tragic 12.9% |
| Immigrants | Albania | 0.1 /100 | #275 | Tragic 13.0% |
| Immigrants | Southern Europe | 0.1 /100 | #276 | Tragic 13.0% |
| Aleuts | 0.1 /100 | #277 | Tragic 13.0% |
| Immigrants | Croatia | 0.1 /100 | #278 | Tragic 13.0% |
| Mongolians | 0.0 /100 | #279 | Tragic 13.1% |
| Alsatians | 0.0 /100 | #280 | Tragic 13.2% |
| Central American Indians | 0.0 /100 | #281 | Tragic 13.3% |
| Immigrants | Eastern Asia | 0.0 /100 | #282 | Tragic 13.5% |
| Immigrants | Kazakhstan | 0.0 /100 | #283 | Tragic 13.6% |
| Immigrants | Malaysia | 0.0 /100 | #284 | Tragic 13.6% |
| Immigrants | Eastern Europe | 0.0 /100 | #285 | Tragic 13.6% |
| Colville | 0.0 /100 | #286 | Tragic 13.7% |
| Immigrants | Ireland | 0.0 /100 | #287 | Tragic 13.7% |
| Hopi | 0.0 /100 | #288 | Tragic 13.7% |
| Immigrants | Australia | 0.0 /100 | #289 | Tragic 13.8% |
| Indians (Asian) | 0.0 /100 | #290 | Tragic 14.1% |
| Okinawans | 0.0 /100 | #291 | Tragic 14.1% |