Spanish American Indian vs Immigrants from Kazakhstan 11th Grade
COMPARE
Spanish American Indian
Immigrants from Kazakhstan
11th Grade
11th Grade Comparison
Spanish American Indians
Immigrants from Kazakhstan
84.7%
11TH GRADE
0.0/ 100
METRIC RATING
346th/ 347
METRIC RANK
93.1%
11TH GRADE
92.4/ 100
METRIC RATING
127th/ 347
METRIC RANK
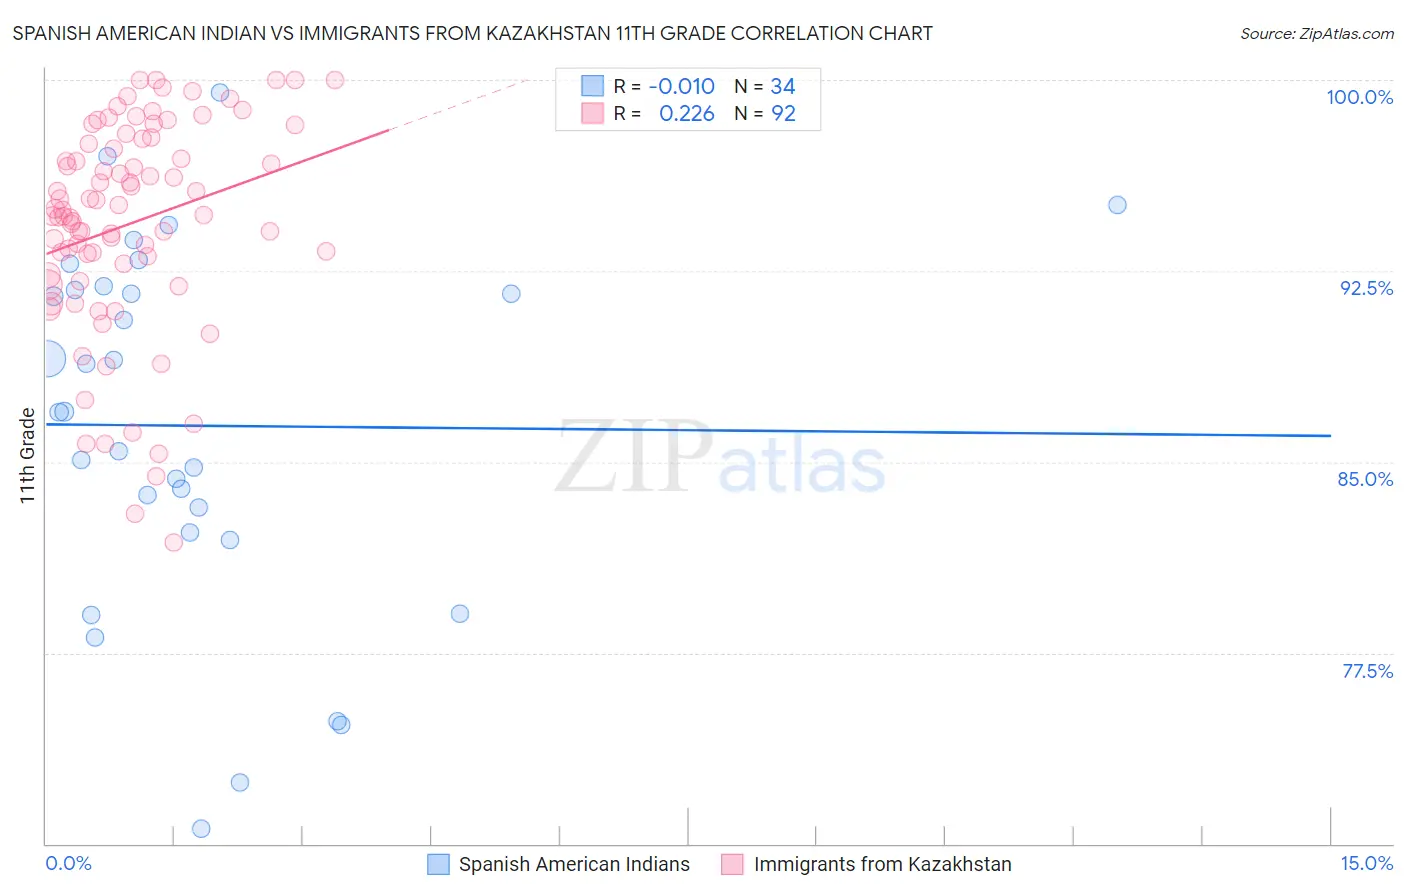
Spanish American Indian vs Immigrants from Kazakhstan 11th Grade Correlation Chart
The statistical analysis conducted on geographies consisting of 73,147,813 people shows no correlation between the proportion of Spanish American Indians and percentage of population with at least 11th grade education in the United States with a correlation coefficient (R) of -0.010 and weighted average of 84.7%. Similarly, the statistical analysis conducted on geographies consisting of 124,444,172 people shows a weak positive correlation between the proportion of Immigrants from Kazakhstan and percentage of population with at least 11th grade education in the United States with a correlation coefficient (R) of 0.226 and weighted average of 93.1%, a difference of 9.9%.
11th Grade Correlation Summary
| Measurement | Spanish American Indian | Immigrants from Kazakhstan |
| Minimum | 70.6% | 81.8% |
| Maximum | 99.5% | 100.0% |
| Range | 29.0% | 18.2% |
| Mean | 86.4% | 94.4% |
| Median | 87.0% | 94.8% |
| Interquartile 25% (IQ1) | 82.2% | 92.6% |
| Interquartile 75% (IQ3) | 91.7% | 97.6% |
| Interquartile Range (IQR) | 9.5% | 5.0% |
| Standard Deviation (Sample) | 7.2% | 4.2% |
| Standard Deviation (Population) | 7.1% | 4.1% |
Similar Demographics by 11th Grade
Demographics Similar to Spanish American Indians by 11th Grade
In terms of 11th grade, the demographic groups most similar to Spanish American Indians are Immigrants from Central America (84.9%, a difference of 0.24%), Yakama (85.0%, a difference of 0.27%), Immigrants from Mexico (84.5%, a difference of 0.30%), Immigrants from El Salvador (85.3%, a difference of 0.68%), and Immigrants from Guatemala (85.8%, a difference of 1.3%).
| Demographics | Rating | Rank | 11th Grade |
| Immigrants | Yemen | 0.0 /100 | #333 | Tragic 87.1% |
| Houma | 0.0 /100 | #334 | Tragic 87.0% |
| Central Americans | 0.0 /100 | #335 | Tragic 86.9% |
| Immigrants | Dominican Republic | 0.0 /100 | #336 | Tragic 86.9% |
| Immigrants | Honduras | 0.0 /100 | #337 | Tragic 86.9% |
| Immigrants | Latin America | 0.0 /100 | #338 | Tragic 86.8% |
| Guatemalans | 0.0 /100 | #339 | Tragic 86.4% |
| Salvadorans | 0.0 /100 | #340 | Tragic 86.2% |
| Mexicans | 0.0 /100 | #341 | Tragic 86.1% |
| Immigrants | Guatemala | 0.0 /100 | #342 | Tragic 85.8% |
| Immigrants | El Salvador | 0.0 /100 | #343 | Tragic 85.3% |
| Yakama | 0.0 /100 | #344 | Tragic 85.0% |
| Immigrants | Central America | 0.0 /100 | #345 | Tragic 84.9% |
| Spanish American Indians | 0.0 /100 | #346 | Tragic 84.7% |
| Immigrants | Mexico | 0.0 /100 | #347 | Tragic 84.5% |
Demographics Similar to Immigrants from Kazakhstan by 11th Grade
In terms of 11th grade, the demographic groups most similar to Immigrants from Kazakhstan are Immigrants from Jordan (93.1%, a difference of 0.0%), Immigrants from Ukraine (93.0%, a difference of 0.080%), Albanian (93.0%, a difference of 0.090%), Egyptian (93.0%, a difference of 0.090%), and Immigrants from Bosnia and Herzegovina (93.0%, a difference of 0.10%).
| Demographics | Rating | Rank | 11th Grade |
| Immigrants | Russia | 96.6 /100 | #120 | Exceptional 93.3% |
| German Russians | 96.4 /100 | #121 | Exceptional 93.3% |
| Immigrants | Belarus | 96.3 /100 | #122 | Exceptional 93.3% |
| Immigrants | Greece | 95.9 /100 | #123 | Exceptional 93.2% |
| Immigrants | Eastern Europe | 95.9 /100 | #124 | Exceptional 93.2% |
| Immigrants | Sri Lanka | 95.6 /100 | #125 | Exceptional 93.2% |
| Basques | 95.2 /100 | #126 | Exceptional 93.2% |
| Immigrants | Kazakhstan | 92.4 /100 | #127 | Exceptional 93.1% |
| Immigrants | Jordan | 92.4 /100 | #128 | Exceptional 93.1% |
| Immigrants | Ukraine | 89.8 /100 | #129 | Excellent 93.0% |
| Albanians | 89.5 /100 | #130 | Excellent 93.0% |
| Egyptians | 89.5 /100 | #131 | Excellent 93.0% |
| Immigrants | Bosnia and Herzegovina | 89.0 /100 | #132 | Excellent 93.0% |
| Mongolians | 87.6 /100 | #133 | Excellent 93.0% |
| Delaware | 87.3 /100 | #134 | Excellent 93.0% |