Immigrants from Argentina vs Immigrants from Kazakhstan No Vehicles in Household
COMPARE
Immigrants from Argentina
Immigrants from Kazakhstan
No Vehicles in Household
No Vehicles in Household Comparison
Immigrants from Argentina
Immigrants from Kazakhstan
11.2%
NO VEHICLES IN HOUSEHOLD
10.6/ 100
METRIC RATING
216th/ 347
METRIC RANK
13.6%
NO VEHICLES IN HOUSEHOLD
0.0/ 100
METRIC RATING
283rd/ 347
METRIC RANK
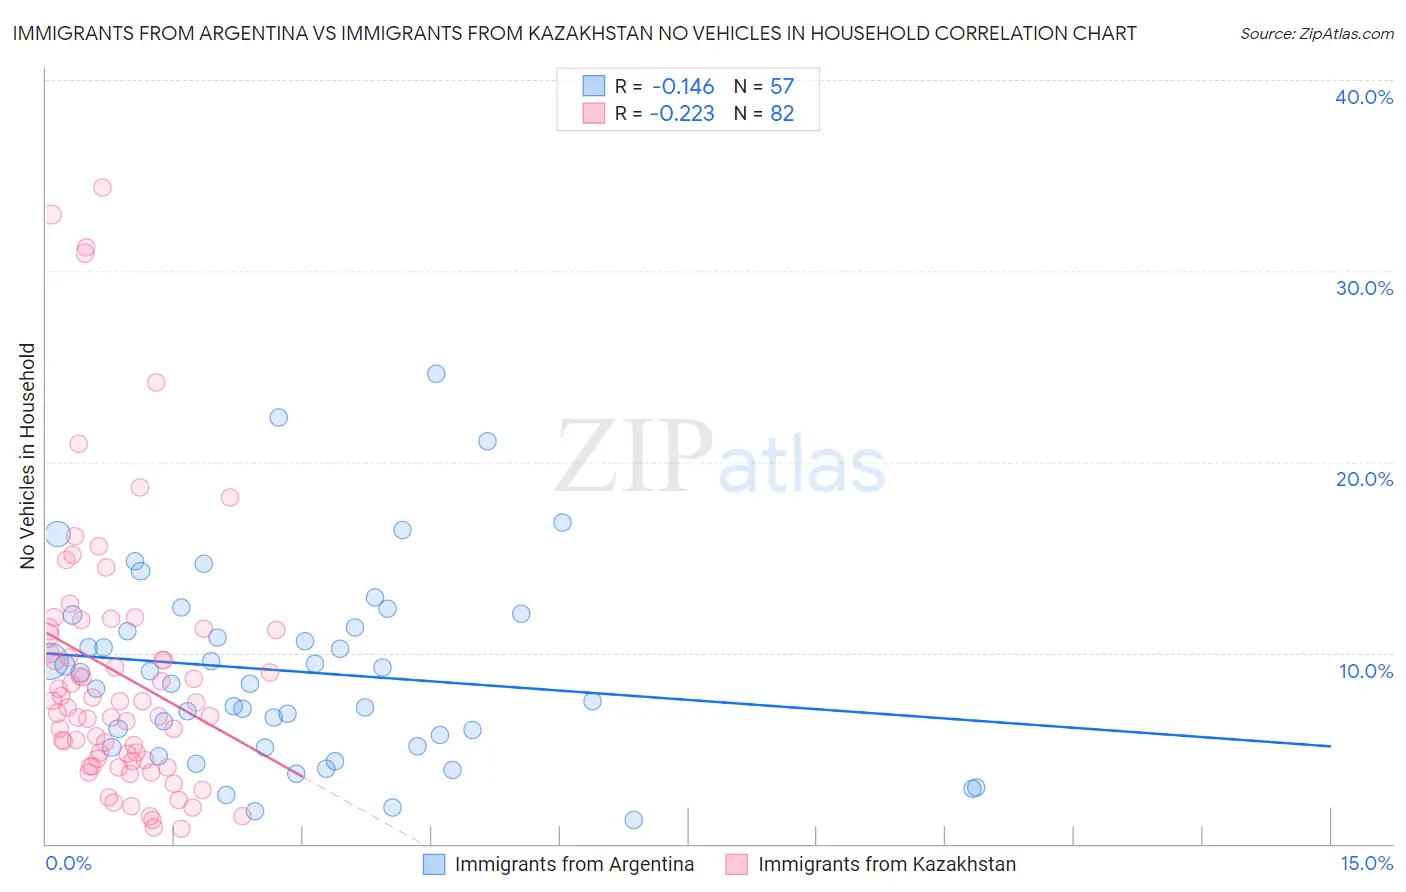
Immigrants from Argentina vs Immigrants from Kazakhstan No Vehicles in Household Correlation Chart
The statistical analysis conducted on geographies consisting of 264,127,238 people shows a poor negative correlation between the proportion of Immigrants from Argentina and percentage of households with no vehicle available in the United States with a correlation coefficient (R) of -0.146 and weighted average of 11.2%. Similarly, the statistical analysis conducted on geographies consisting of 124,281,418 people shows a weak negative correlation between the proportion of Immigrants from Kazakhstan and percentage of households with no vehicle available in the United States with a correlation coefficient (R) of -0.223 and weighted average of 13.6%, a difference of 21.5%.
No Vehicles in Household Correlation Summary
| Measurement | Immigrants from Argentina | Immigrants from Kazakhstan |
| Minimum | 1.2% | 0.77% |
| Maximum | 24.6% | 34.4% |
| Range | 23.3% | 33.6% |
| Mean | 9.0% | 8.9% |
| Median | 8.4% | 7.3% |
| Interquartile 25% (IQ1) | 5.1% | 4.4% |
| Interquartile 75% (IQ3) | 11.6% | 11.2% |
| Interquartile Range (IQR) | 6.6% | 6.9% |
| Standard Deviation (Sample) | 5.1% | 7.1% |
| Standard Deviation (Population) | 5.0% | 7.0% |
Similar Demographics by No Vehicles in Household
Demographics Similar to Immigrants from Argentina by No Vehicles in Household
In terms of no vehicles in household, the demographic groups most similar to Immigrants from Argentina are Immigrants from Sri Lanka (11.2%, a difference of 0.0%), Dutch West Indian (11.2%, a difference of 0.12%), Immigrants from Guatemala (11.2%, a difference of 0.22%), Argentinean (11.2%, a difference of 0.35%), and Immigrants from Zaire (11.2%, a difference of 0.36%).
| Demographics | Rating | Rank | No Vehicles in Household |
| Pennsylvania Germans | 15.5 /100 | #209 | Poor 11.0% |
| Apache | 14.8 /100 | #210 | Poor 11.0% |
| Crow | 14.2 /100 | #211 | Poor 11.0% |
| Immigrants | Western Asia | 13.9 /100 | #212 | Poor 11.0% |
| Immigrants | Hungary | 12.3 /100 | #213 | Poor 11.1% |
| Immigrants | Denmark | 12.1 /100 | #214 | Poor 11.1% |
| Immigrants | Sri Lanka | 10.6 /100 | #215 | Poor 11.2% |
| Immigrants | Argentina | 10.6 /100 | #216 | Poor 11.2% |
| Dutch West Indians | 10.2 /100 | #217 | Poor 11.2% |
| Immigrants | Guatemala | 10.0 /100 | #218 | Tragic 11.2% |
| Argentineans | 9.6 /100 | #219 | Tragic 11.2% |
| Immigrants | Zaire | 9.6 /100 | #220 | Tragic 11.2% |
| Peruvians | 8.4 /100 | #221 | Tragic 11.2% |
| Immigrants | South America | 8.0 /100 | #222 | Tragic 11.3% |
| Uruguayans | 7.7 /100 | #223 | Tragic 11.3% |
Demographics Similar to Immigrants from Kazakhstan by No Vehicles in Household
In terms of no vehicles in household, the demographic groups most similar to Immigrants from Kazakhstan are Immigrants from Eastern Asia (13.5%, a difference of 0.040%), Immigrants from Malaysia (13.6%, a difference of 0.24%), Immigrants from Eastern Europe (13.6%, a difference of 0.30%), Colville (13.7%, a difference of 0.96%), and Immigrants from Ireland (13.7%, a difference of 1.2%).
| Demographics | Rating | Rank | No Vehicles in Household |
| Immigrants | Southern Europe | 0.1 /100 | #276 | Tragic 13.0% |
| Aleuts | 0.1 /100 | #277 | Tragic 13.0% |
| Immigrants | Croatia | 0.1 /100 | #278 | Tragic 13.0% |
| Mongolians | 0.0 /100 | #279 | Tragic 13.1% |
| Alsatians | 0.0 /100 | #280 | Tragic 13.2% |
| Central American Indians | 0.0 /100 | #281 | Tragic 13.3% |
| Immigrants | Eastern Asia | 0.0 /100 | #282 | Tragic 13.5% |
| Immigrants | Kazakhstan | 0.0 /100 | #283 | Tragic 13.6% |
| Immigrants | Malaysia | 0.0 /100 | #284 | Tragic 13.6% |
| Immigrants | Eastern Europe | 0.0 /100 | #285 | Tragic 13.6% |
| Colville | 0.0 /100 | #286 | Tragic 13.7% |
| Immigrants | Ireland | 0.0 /100 | #287 | Tragic 13.7% |
| Hopi | 0.0 /100 | #288 | Tragic 13.7% |
| Immigrants | Australia | 0.0 /100 | #289 | Tragic 13.8% |
| Indians (Asian) | 0.0 /100 | #290 | Tragic 14.1% |