Spanish American Indian vs Alaska Native No Vehicles in Household
COMPARE
Spanish American Indian
Alaska Native
No Vehicles in Household
No Vehicles in Household Comparison
Spanish American Indians
Alaska Natives
10.1%
NO VEHICLES IN HOUSEHOLD
70.2/ 100
METRIC RATING
158th/ 347
METRIC RANK
17.4%
NO VEHICLES IN HOUSEHOLD
0.0/ 100
METRIC RATING
319th/ 347
METRIC RANK
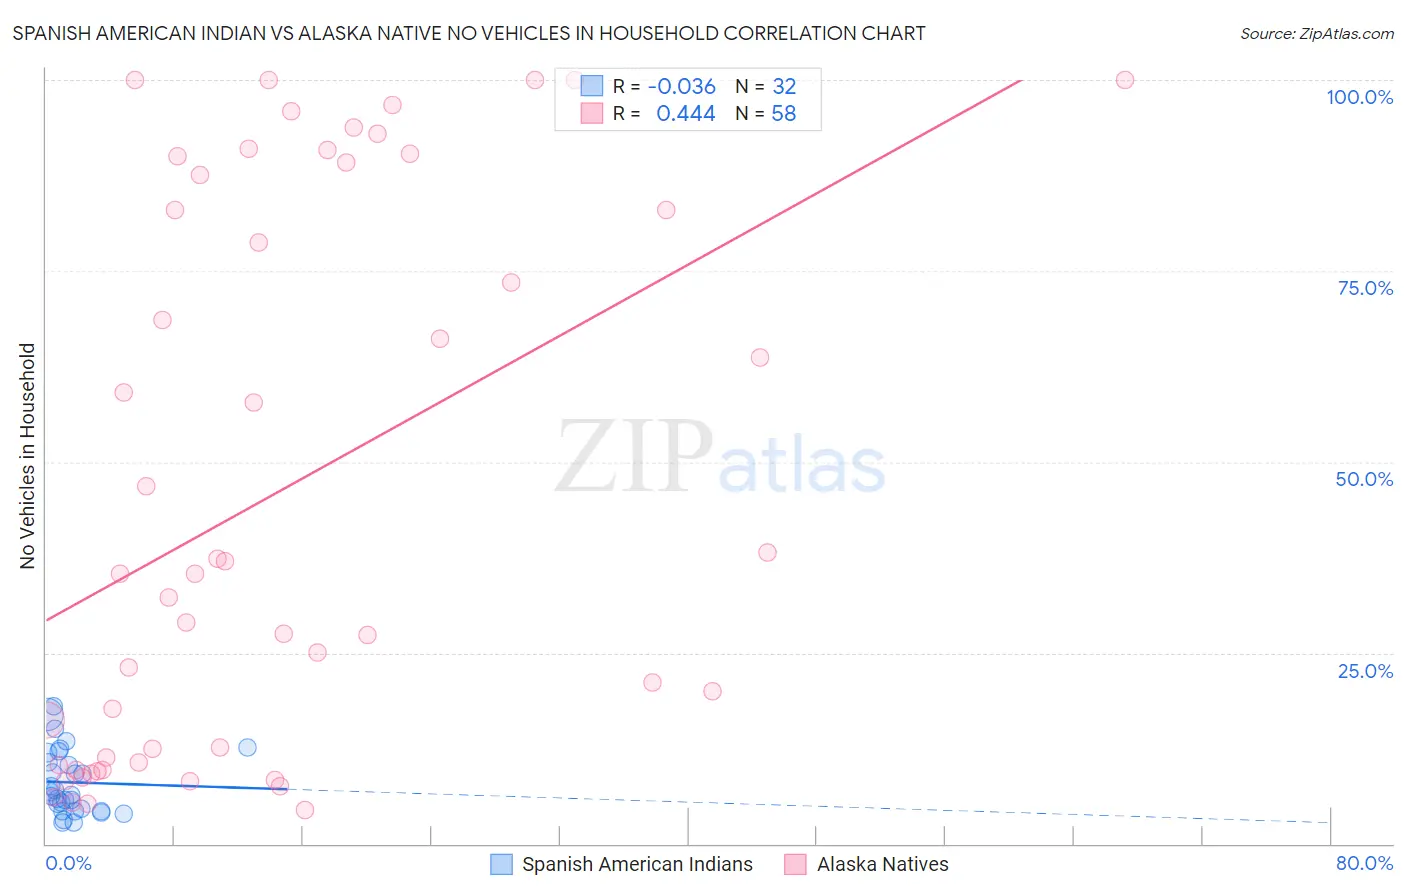
Spanish American Indian vs Alaska Native No Vehicles in Household Correlation Chart
The statistical analysis conducted on geographies consisting of 73,126,627 people shows no correlation between the proportion of Spanish American Indians and percentage of households with no vehicle available in the United States with a correlation coefficient (R) of -0.036 and weighted average of 10.1%. Similarly, the statistical analysis conducted on geographies consisting of 76,683,354 people shows a moderate positive correlation between the proportion of Alaska Natives and percentage of households with no vehicle available in the United States with a correlation coefficient (R) of 0.444 and weighted average of 17.4%, a difference of 72.3%.
No Vehicles in Household Correlation Summary
| Measurement | Spanish American Indian | Alaska Native |
| Minimum | 2.8% | 4.5% |
| Maximum | 18.0% | 100.0% |
| Range | 15.2% | 95.5% |
| Mean | 8.0% | 46.2% |
| Median | 6.6% | 35.3% |
| Interquartile 25% (IQ1) | 4.4% | 10.7% |
| Interquartile 75% (IQ3) | 11.3% | 87.5% |
| Interquartile Range (IQR) | 6.8% | 76.8% |
| Standard Deviation (Sample) | 4.2% | 35.6% |
| Standard Deviation (Population) | 4.1% | 35.3% |
Similar Demographics by No Vehicles in Household
Demographics Similar to Spanish American Indians by No Vehicles in Household
In terms of no vehicles in household, the demographic groups most similar to Spanish American Indians are Australian (10.1%, a difference of 0.060%), Immigrants from Micronesia (10.1%, a difference of 0.11%), Immigrants from Indonesia (10.1%, a difference of 0.15%), Salvadoran (10.1%, a difference of 0.36%), and Sioux (10.1%, a difference of 0.37%).
| Demographics | Rating | Rank | No Vehicles in Household |
| Immigrants | Eastern Africa | 73.8 /100 | #151 | Good 10.0% |
| Immigrants | Congo | 73.0 /100 | #152 | Good 10.1% |
| Tlingit-Haida | 72.5 /100 | #153 | Good 10.1% |
| Sioux | 72.4 /100 | #154 | Good 10.1% |
| Salvadorans | 72.4 /100 | #155 | Good 10.1% |
| Immigrants | Micronesia | 70.9 /100 | #156 | Good 10.1% |
| Australians | 70.6 /100 | #157 | Good 10.1% |
| Spanish American Indians | 70.2 /100 | #158 | Good 10.1% |
| Immigrants | Indonesia | 69.3 /100 | #159 | Good 10.1% |
| Immigrants | Middle Africa | 65.7 /100 | #160 | Good 10.2% |
| New Zealanders | 65.1 /100 | #161 | Good 10.2% |
| Immigrants | Austria | 64.4 /100 | #162 | Good 10.2% |
| Immigrants | Cambodia | 63.7 /100 | #163 | Good 10.2% |
| South Africans | 61.1 /100 | #164 | Good 10.2% |
| Comanche | 60.8 /100 | #165 | Good 10.2% |
Demographics Similar to Alaska Natives by No Vehicles in Household
In terms of no vehicles in household, the demographic groups most similar to Alaska Natives are Soviet Union (17.4%, a difference of 0.16%), Jamaican (17.9%, a difference of 3.0%), Immigrants from Belarus (16.7%, a difference of 3.9%), Immigrants from Ghana (16.6%, a difference of 4.8%), and Ghanaian (16.4%, a difference of 5.8%).
| Demographics | Rating | Rank | No Vehicles in Household |
| Alaskan Athabascans | 0.0 /100 | #312 | Tragic 15.6% |
| Tohono O'odham | 0.0 /100 | #313 | Tragic 15.6% |
| Albanians | 0.0 /100 | #314 | Tragic 15.6% |
| Cypriots | 0.0 /100 | #315 | Tragic 15.7% |
| Ghanaians | 0.0 /100 | #316 | Tragic 16.4% |
| Immigrants | Ghana | 0.0 /100 | #317 | Tragic 16.6% |
| Immigrants | Belarus | 0.0 /100 | #318 | Tragic 16.7% |
| Alaska Natives | 0.0 /100 | #319 | Tragic 17.4% |
| Soviet Union | 0.0 /100 | #320 | Tragic 17.4% |
| Jamaicans | 0.0 /100 | #321 | Tragic 17.9% |
| Immigrants | Cabo Verde | 0.0 /100 | #322 | Tragic 18.4% |
| Immigrants | Yemen | 0.0 /100 | #323 | Tragic 19.5% |
| Immigrants | Caribbean | 0.0 /100 | #324 | Tragic 19.6% |
| Senegalese | 0.0 /100 | #325 | Tragic 19.8% |
| Immigrants | West Indies | 0.0 /100 | #326 | Tragic 20.5% |