Spanish American Indian vs Immigrants from Kazakhstan Female Poverty Among 18-24 Year Olds
COMPARE
Spanish American Indian
Immigrants from Kazakhstan
Female Poverty Among 18-24 Year Olds
Female Poverty Among 18-24 Year Olds Comparison
Spanish American Indians
Immigrants from Kazakhstan
18.1%
FEMALE POVERTY AMONG 18-24 YEAR OLDS
100.0/ 100
METRIC RATING
45th/ 347
METRIC RANK
20.2%
FEMALE POVERTY AMONG 18-24 YEAR OLDS
44.2/ 100
METRIC RATING
177th/ 347
METRIC RANK
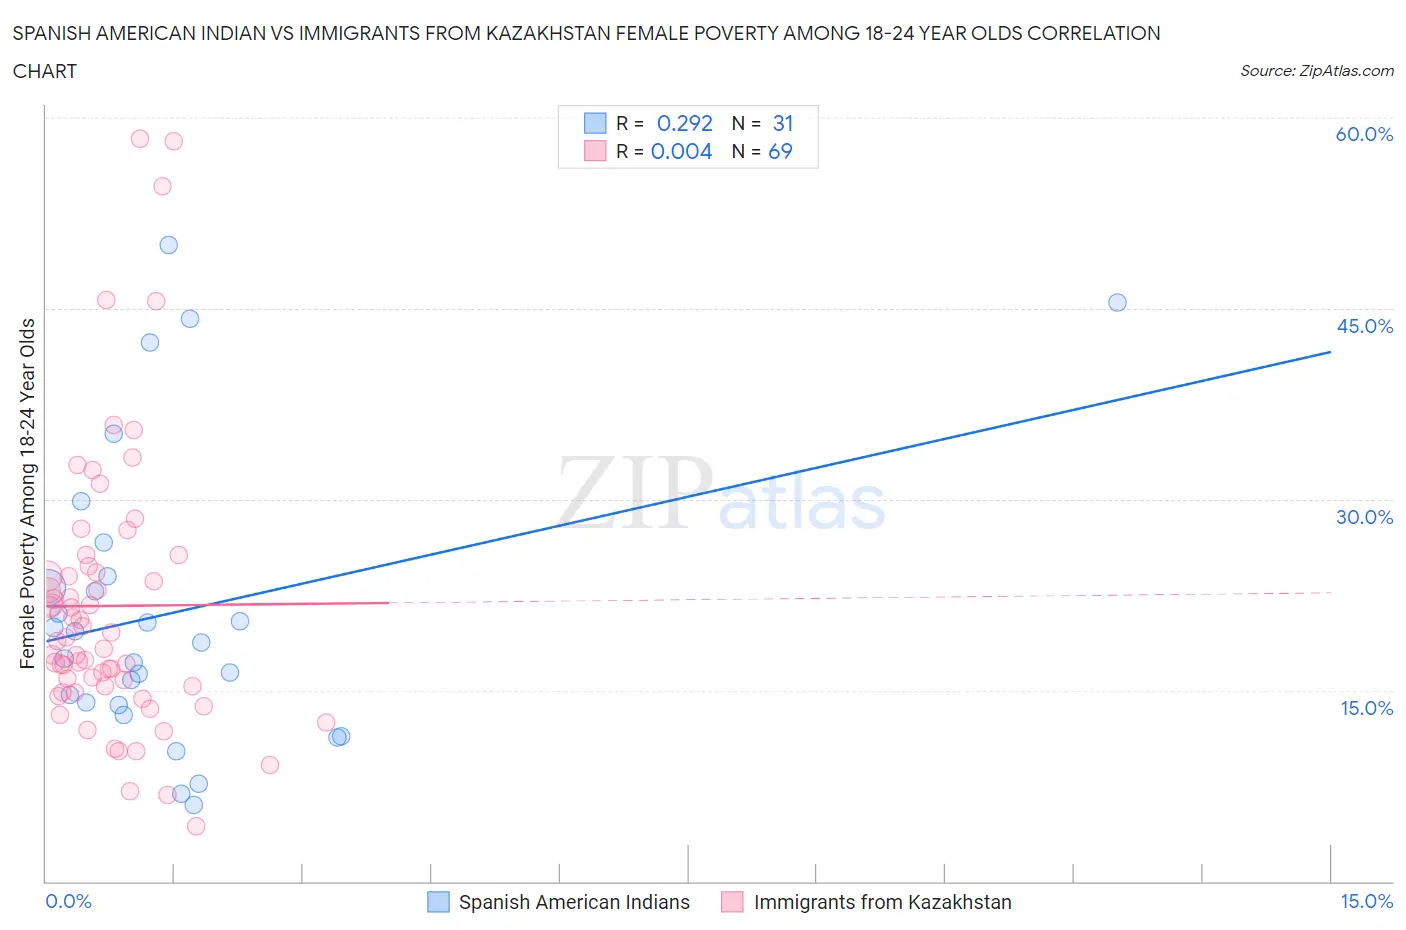
Spanish American Indian vs Immigrants from Kazakhstan Female Poverty Among 18-24 Year Olds Correlation Chart
The statistical analysis conducted on geographies consisting of 73,008,274 people shows a weak positive correlation between the proportion of Spanish American Indians and poverty level among females between the ages 18 and 24 in the United States with a correlation coefficient (R) of 0.292 and weighted average of 18.1%. Similarly, the statistical analysis conducted on geographies consisting of 123,639,864 people shows no correlation between the proportion of Immigrants from Kazakhstan and poverty level among females between the ages 18 and 24 in the United States with a correlation coefficient (R) of 0.004 and weighted average of 20.2%, a difference of 11.3%.
Female Poverty Among 18-24 Year Olds Correlation Summary
| Measurement | Spanish American Indian | Immigrants from Kazakhstan |
| Minimum | 6.0% | 4.3% |
| Maximum | 50.0% | 58.3% |
| Range | 44.0% | 54.0% |
| Mean | 21.2% | 21.6% |
| Median | 18.8% | 18.9% |
| Interquartile 25% (IQ1) | 13.8% | 15.1% |
| Interquartile 75% (IQ3) | 24.0% | 24.5% |
| Interquartile Range (IQR) | 10.1% | 9.4% |
| Standard Deviation (Sample) | 11.5% | 11.1% |
| Standard Deviation (Population) | 11.3% | 11.0% |
Similar Demographics by Female Poverty Among 18-24 Year Olds
Demographics Similar to Spanish American Indians by Female Poverty Among 18-24 Year Olds
In terms of female poverty among 18-24 year olds, the demographic groups most similar to Spanish American Indians are Nicaraguan (18.1%, a difference of 0.090%), Macedonian (18.1%, a difference of 0.17%), Bulgarian (18.1%, a difference of 0.18%), Immigrants from Southern Europe (18.2%, a difference of 0.28%), and Asian (18.2%, a difference of 0.37%).
| Demographics | Rating | Rank | Female Poverty Among 18-24 Year Olds |
| South Americans | 100.0 /100 | #38 | Exceptional 18.0% |
| Puget Sound Salish | 100.0 /100 | #39 | Exceptional 18.0% |
| Immigrants | Romania | 100.0 /100 | #40 | Exceptional 18.0% |
| Immigrants | Argentina | 100.0 /100 | #41 | Exceptional 18.0% |
| Bulgarians | 100.0 /100 | #42 | Exceptional 18.1% |
| Macedonians | 100.0 /100 | #43 | Exceptional 18.1% |
| Nicaraguans | 100.0 /100 | #44 | Exceptional 18.1% |
| Spanish American Indians | 100.0 /100 | #45 | Exceptional 18.1% |
| Immigrants | Southern Europe | 100.0 /100 | #46 | Exceptional 18.2% |
| Asians | 100.0 /100 | #47 | Exceptional 18.2% |
| Sri Lankans | 100.0 /100 | #48 | Exceptional 18.2% |
| Bhutanese | 100.0 /100 | #49 | Exceptional 18.2% |
| Samoans | 100.0 /100 | #50 | Exceptional 18.2% |
| Immigrants | Eastern Europe | 99.9 /100 | #51 | Exceptional 18.2% |
| Immigrants | Ireland | 99.9 /100 | #52 | Exceptional 18.3% |
Demographics Similar to Immigrants from Kazakhstan by Female Poverty Among 18-24 Year Olds
In terms of female poverty among 18-24 year olds, the demographic groups most similar to Immigrants from Kazakhstan are Swiss (20.2%, a difference of 0.010%), Ethiopian (20.2%, a difference of 0.020%), Kenyan (20.2%, a difference of 0.040%), Iraqi (20.2%, a difference of 0.040%), and Immigrants from China (20.2%, a difference of 0.060%).
| Demographics | Rating | Rank | Female Poverty Among 18-24 Year Olds |
| Iranians | 54.7 /100 | #170 | Average 20.1% |
| Immigrants | Nigeria | 54.3 /100 | #171 | Average 20.1% |
| Belizeans | 52.0 /100 | #172 | Average 20.1% |
| Irish | 50.0 /100 | #173 | Average 20.1% |
| Swedes | 50.0 /100 | #174 | Average 20.1% |
| South American Indians | 48.4 /100 | #175 | Average 20.1% |
| Kenyans | 44.9 /100 | #176 | Average 20.2% |
| Immigrants | Kazakhstan | 44.2 /100 | #177 | Average 20.2% |
| Swiss | 44.0 /100 | #178 | Average 20.2% |
| Ethiopians | 43.8 /100 | #179 | Average 20.2% |
| Iraqis | 43.3 /100 | #180 | Average 20.2% |
| Immigrants | China | 43.0 /100 | #181 | Average 20.2% |
| Immigrants | Barbados | 42.8 /100 | #182 | Average 20.2% |
| Lebanese | 40.6 /100 | #183 | Average 20.2% |
| Immigrants | Central America | 39.9 /100 | #184 | Fair 20.2% |