Soviet Union vs Immigrants from Bangladesh 1 or more Vehicles in Household
COMPARE
Soviet Union
Immigrants from Bangladesh
1 or more Vehicles in Household
1 or more Vehicles in Household Comparison
Soviet Union
Immigrants from Bangladesh
82.7%
1 OR MORE VEHICLES IN HOUSEHOLD
0.0/ 100
METRIC RATING
320th/ 347
METRIC RANK
74.3%
1 OR MORE VEHICLES IN HOUSEHOLD
0.0/ 100
METRIC RATING
334th/ 347
METRIC RANK
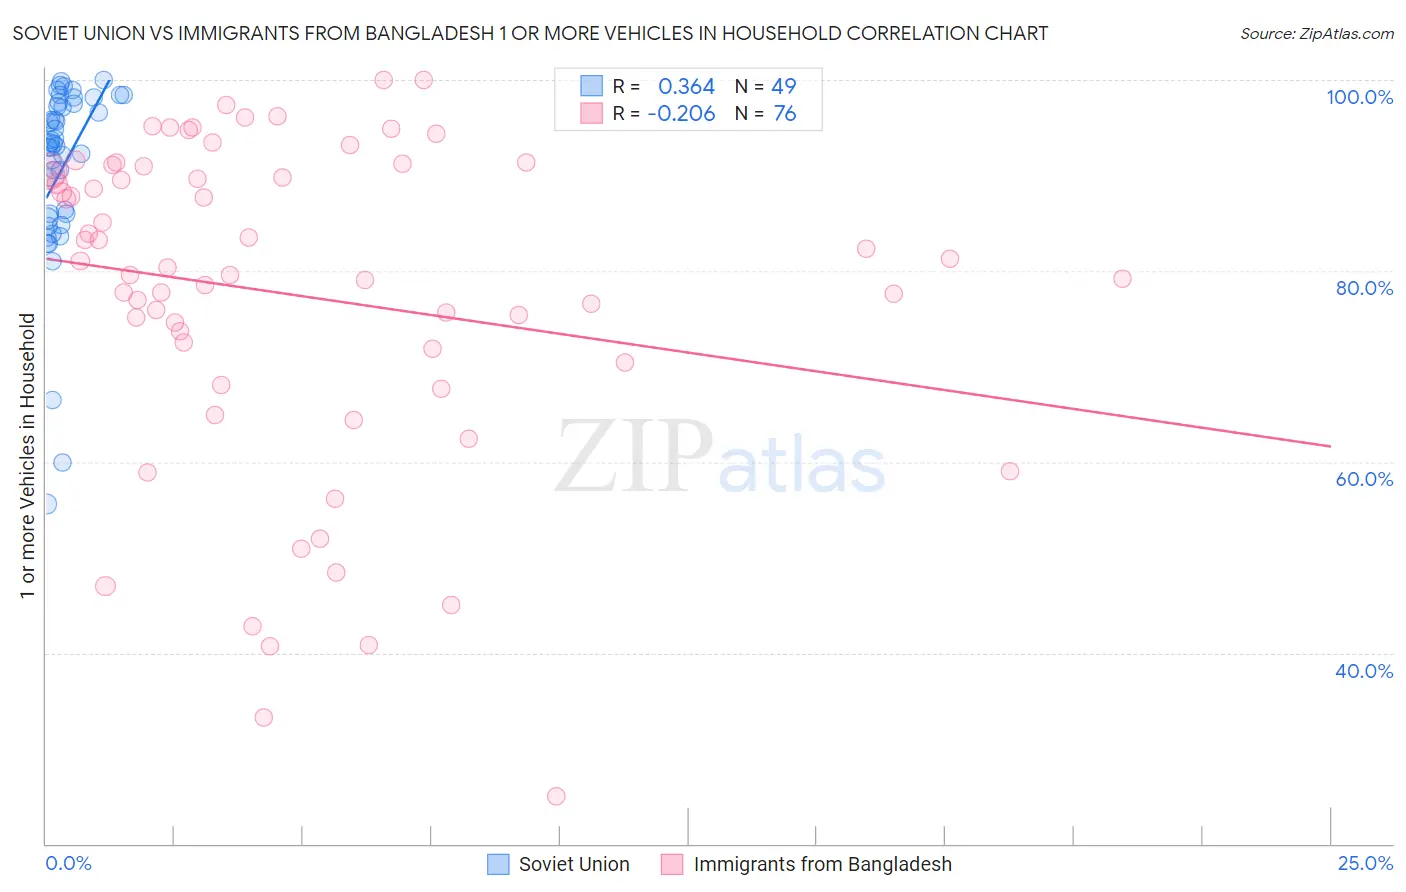
Soviet Union vs Immigrants from Bangladesh 1 or more Vehicles in Household Correlation Chart
The statistical analysis conducted on geographies consisting of 43,492,822 people shows a mild positive correlation between the proportion of Soviet Union and percentage of households with 1 or more vehicles available in the United States with a correlation coefficient (R) of 0.364 and weighted average of 82.7%. Similarly, the statistical analysis conducted on geographies consisting of 203,601,169 people shows a weak negative correlation between the proportion of Immigrants from Bangladesh and percentage of households with 1 or more vehicles available in the United States with a correlation coefficient (R) of -0.206 and weighted average of 74.3%, a difference of 11.3%.
1 or more Vehicles in Household Correlation Summary
| Measurement | Soviet Union | Immigrants from Bangladesh |
| Minimum | 55.6% | 25.0% |
| Maximum | 100.0% | 100.0% |
| Range | 44.4% | 75.0% |
| Mean | 90.7% | 77.5% |
| Median | 93.3% | 80.7% |
| Interquartile 25% (IQ1) | 85.7% | 71.2% |
| Interquartile 75% (IQ3) | 97.6% | 90.7% |
| Interquartile Range (IQR) | 11.8% | 19.5% |
| Standard Deviation (Sample) | 9.6% | 17.2% |
| Standard Deviation (Population) | 9.5% | 17.1% |
Demographics Similar to Soviet Union and Immigrants from Bangladesh by 1 or more Vehicles in Household
In terms of 1 or more vehicles in household, the demographic groups most similar to Soviet Union are Jamaican (82.1%, a difference of 0.64%), Immigrants from Belarus (83.3%, a difference of 0.81%), Immigrants from Ghana (83.4%, a difference of 0.94%), Ghanaian (83.6%, a difference of 1.1%), and Immigrants from Cabo Verde (81.6%, a difference of 1.3%). Similarly, the demographic groups most similar to Immigrants from Bangladesh are Barbadian (74.0%, a difference of 0.44%), Vietnamese (73.8%, a difference of 0.65%), Immigrants from Uzbekistan (73.4%, a difference of 1.3%), Immigrants from Ecuador (76.2%, a difference of 2.6%), and Trinidadian and Tobagonian (76.3%, a difference of 2.7%).
| Demographics | Rating | Rank | 1 or more Vehicles in Household |
| Ghanaians | 0.0 /100 | #317 | Tragic 83.6% |
| Immigrants | Ghana | 0.0 /100 | #318 | Tragic 83.4% |
| Immigrants | Belarus | 0.0 /100 | #319 | Tragic 83.3% |
| Soviet Union | 0.0 /100 | #320 | Tragic 82.7% |
| Jamaicans | 0.0 /100 | #321 | Tragic 82.1% |
| Immigrants | Cabo Verde | 0.0 /100 | #322 | Tragic 81.6% |
| Immigrants | Yemen | 0.0 /100 | #323 | Tragic 80.5% |
| Immigrants | Caribbean | 0.0 /100 | #324 | Tragic 80.4% |
| Senegalese | 0.0 /100 | #325 | Tragic 80.4% |
| Immigrants | West Indies | 0.0 /100 | #326 | Tragic 79.5% |
| Immigrants | Senegal | 0.0 /100 | #327 | Tragic 79.0% |
| Ecuadorians | 0.0 /100 | #328 | Tragic 77.9% |
| Immigrants | Dominica | 0.0 /100 | #329 | Tragic 77.8% |
| Immigrants | Trinidad and Tobago | 0.0 /100 | #330 | Tragic 76.8% |
| West Indians | 0.0 /100 | #331 | Tragic 76.4% |
| Trinidadians and Tobagonians | 0.0 /100 | #332 | Tragic 76.3% |
| Immigrants | Ecuador | 0.0 /100 | #333 | Tragic 76.2% |
| Immigrants | Bangladesh | 0.0 /100 | #334 | Tragic 74.3% |
| Barbadians | 0.0 /100 | #335 | Tragic 74.0% |
| Vietnamese | 0.0 /100 | #336 | Tragic 73.8% |
| Immigrants | Uzbekistan | 0.0 /100 | #337 | Tragic 73.4% |