Soviet Union vs Northern European 1 or more Vehicles in Household
COMPARE
Soviet Union
Northern European
1 or more Vehicles in Household
1 or more Vehicles in Household Comparison
Soviet Union
Northern Europeans
82.7%
1 OR MORE VEHICLES IN HOUSEHOLD
0.0/ 100
METRIC RATING
320th/ 347
METRIC RANK
92.2%
1 OR MORE VEHICLES IN HOUSEHOLD
99.9/ 100
METRIC RATING
47th/ 347
METRIC RANK
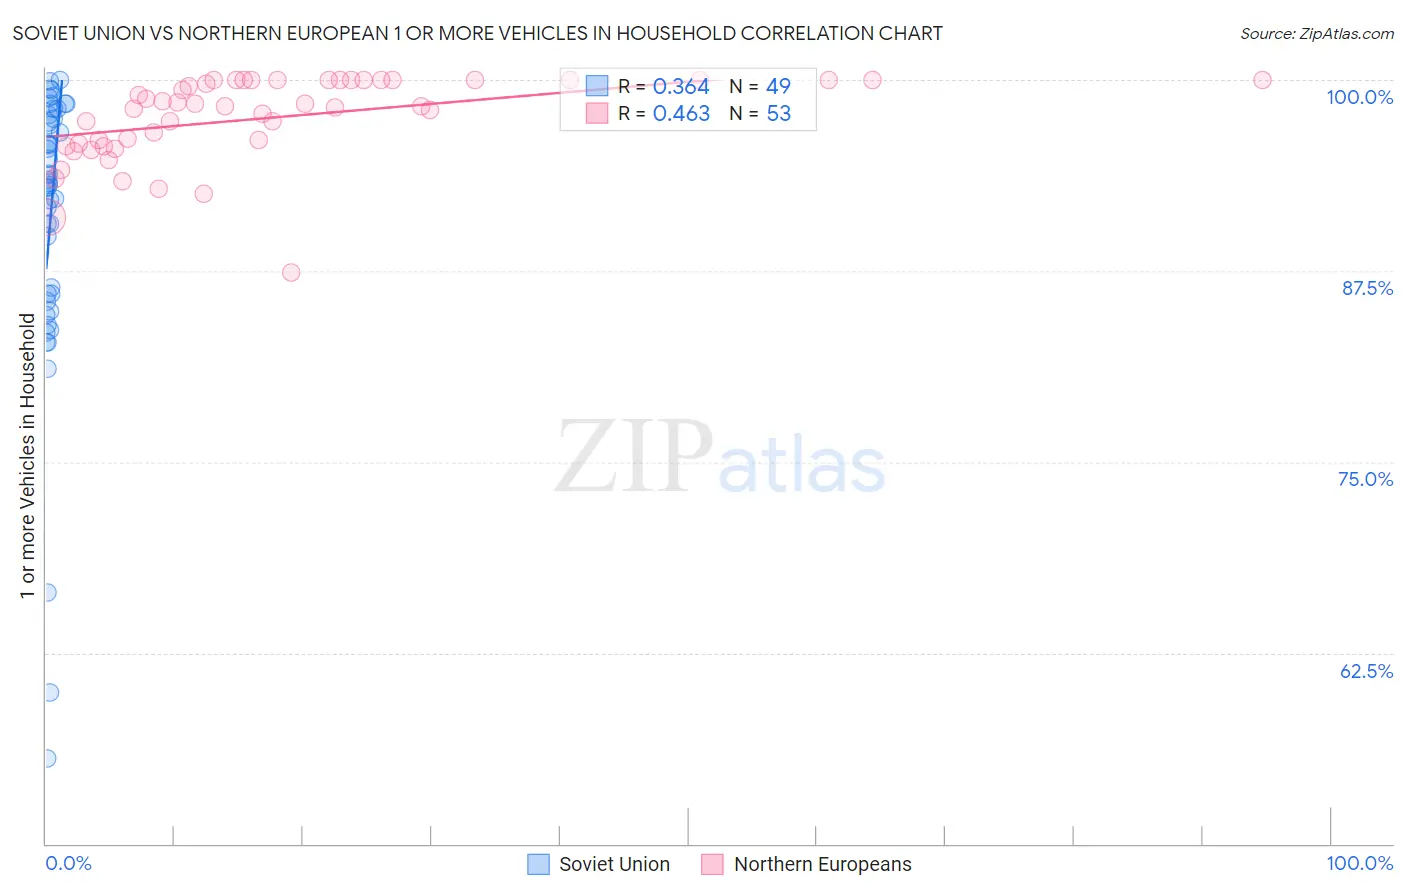
Soviet Union vs Northern European 1 or more Vehicles in Household Correlation Chart
The statistical analysis conducted on geographies consisting of 43,492,822 people shows a mild positive correlation between the proportion of Soviet Union and percentage of households with 1 or more vehicles available in the United States with a correlation coefficient (R) of 0.364 and weighted average of 82.7%. Similarly, the statistical analysis conducted on geographies consisting of 405,964,648 people shows a moderate positive correlation between the proportion of Northern Europeans and percentage of households with 1 or more vehicles available in the United States with a correlation coefficient (R) of 0.463 and weighted average of 92.2%, a difference of 11.5%.
1 or more Vehicles in Household Correlation Summary
| Measurement | Soviet Union | Northern European |
| Minimum | 55.6% | 87.4% |
| Maximum | 100.0% | 100.0% |
| Range | 44.4% | 12.6% |
| Mean | 90.7% | 97.5% |
| Median | 93.3% | 98.3% |
| Interquartile 25% (IQ1) | 85.7% | 95.8% |
| Interquartile 75% (IQ3) | 97.6% | 100.0% |
| Interquartile Range (IQR) | 11.8% | 4.2% |
| Standard Deviation (Sample) | 9.6% | 2.8% |
| Standard Deviation (Population) | 9.5% | 2.7% |
Similar Demographics by 1 or more Vehicles in Household
Demographics Similar to Soviet Union by 1 or more Vehicles in Household
In terms of 1 or more vehicles in household, the demographic groups most similar to Soviet Union are Jamaican (82.1%, a difference of 0.64%), Immigrants from Belarus (83.3%, a difference of 0.81%), Immigrants from Ghana (83.4%, a difference of 0.94%), Ghanaian (83.6%, a difference of 1.1%), and Immigrants from Cabo Verde (81.6%, a difference of 1.3%).
| Demographics | Rating | Rank | 1 or more Vehicles in Household |
| Immigrants | Israel | 0.0 /100 | #313 | Tragic 84.5% |
| Albanians | 0.0 /100 | #314 | Tragic 84.4% |
| Cypriots | 0.0 /100 | #315 | Tragic 84.4% |
| Alaska Natives | 0.0 /100 | #316 | Tragic 83.8% |
| Ghanaians | 0.0 /100 | #317 | Tragic 83.6% |
| Immigrants | Ghana | 0.0 /100 | #318 | Tragic 83.4% |
| Immigrants | Belarus | 0.0 /100 | #319 | Tragic 83.3% |
| Soviet Union | 0.0 /100 | #320 | Tragic 82.7% |
| Jamaicans | 0.0 /100 | #321 | Tragic 82.1% |
| Immigrants | Cabo Verde | 0.0 /100 | #322 | Tragic 81.6% |
| Immigrants | Yemen | 0.0 /100 | #323 | Tragic 80.5% |
| Immigrants | Caribbean | 0.0 /100 | #324 | Tragic 80.4% |
| Senegalese | 0.0 /100 | #325 | Tragic 80.4% |
| Immigrants | West Indies | 0.0 /100 | #326 | Tragic 79.5% |
| Immigrants | Senegal | 0.0 /100 | #327 | Tragic 79.0% |
Demographics Similar to Northern Europeans by 1 or more Vehicles in Household
In terms of 1 or more vehicles in household, the demographic groups most similar to Northern Europeans are Immigrants from Fiji (92.2%, a difference of 0.010%), Nonimmigrants (92.2%, a difference of 0.030%), Choctaw (92.2%, a difference of 0.050%), Chickasaw (92.3%, a difference of 0.070%), and Spanish (92.3%, a difference of 0.070%).
| Demographics | Rating | Rank | 1 or more Vehicles in Household |
| Creek | 99.9 /100 | #40 | Exceptional 92.3% |
| Immigrants | Taiwan | 99.9 /100 | #41 | Exceptional 92.3% |
| Chickasaw | 99.9 /100 | #42 | Exceptional 92.3% |
| Spanish | 99.9 /100 | #43 | Exceptional 92.3% |
| Choctaw | 99.9 /100 | #44 | Exceptional 92.2% |
| Immigrants | Nonimmigrants | 99.9 /100 | #45 | Exceptional 92.2% |
| Immigrants | Fiji | 99.9 /100 | #46 | Exceptional 92.2% |
| Northern Europeans | 99.9 /100 | #47 | Exceptional 92.2% |
| Belgians | 99.9 /100 | #48 | Exceptional 92.1% |
| Afghans | 99.9 /100 | #49 | Exceptional 92.1% |
| Guamanians/Chamorros | 99.9 /100 | #50 | Exceptional 92.1% |
| Celtics | 99.9 /100 | #51 | Exceptional 92.1% |
| Koreans | 99.9 /100 | #52 | Exceptional 92.1% |
| Hawaiians | 99.9 /100 | #53 | Exceptional 92.0% |
| Slovenes | 99.9 /100 | #54 | Exceptional 92.0% |