Sioux vs Kiowa Median Female Earnings
COMPARE
Sioux
Kiowa
Median Female Earnings
Median Female Earnings Comparison
Sioux
Kiowa
$35,063
MEDIAN FEMALE EARNINGS
0.0/ 100
METRIC RATING
307th/ 347
METRIC RANK
$34,074
MEDIAN FEMALE EARNINGS
0.0/ 100
METRIC RATING
326th/ 347
METRIC RANK
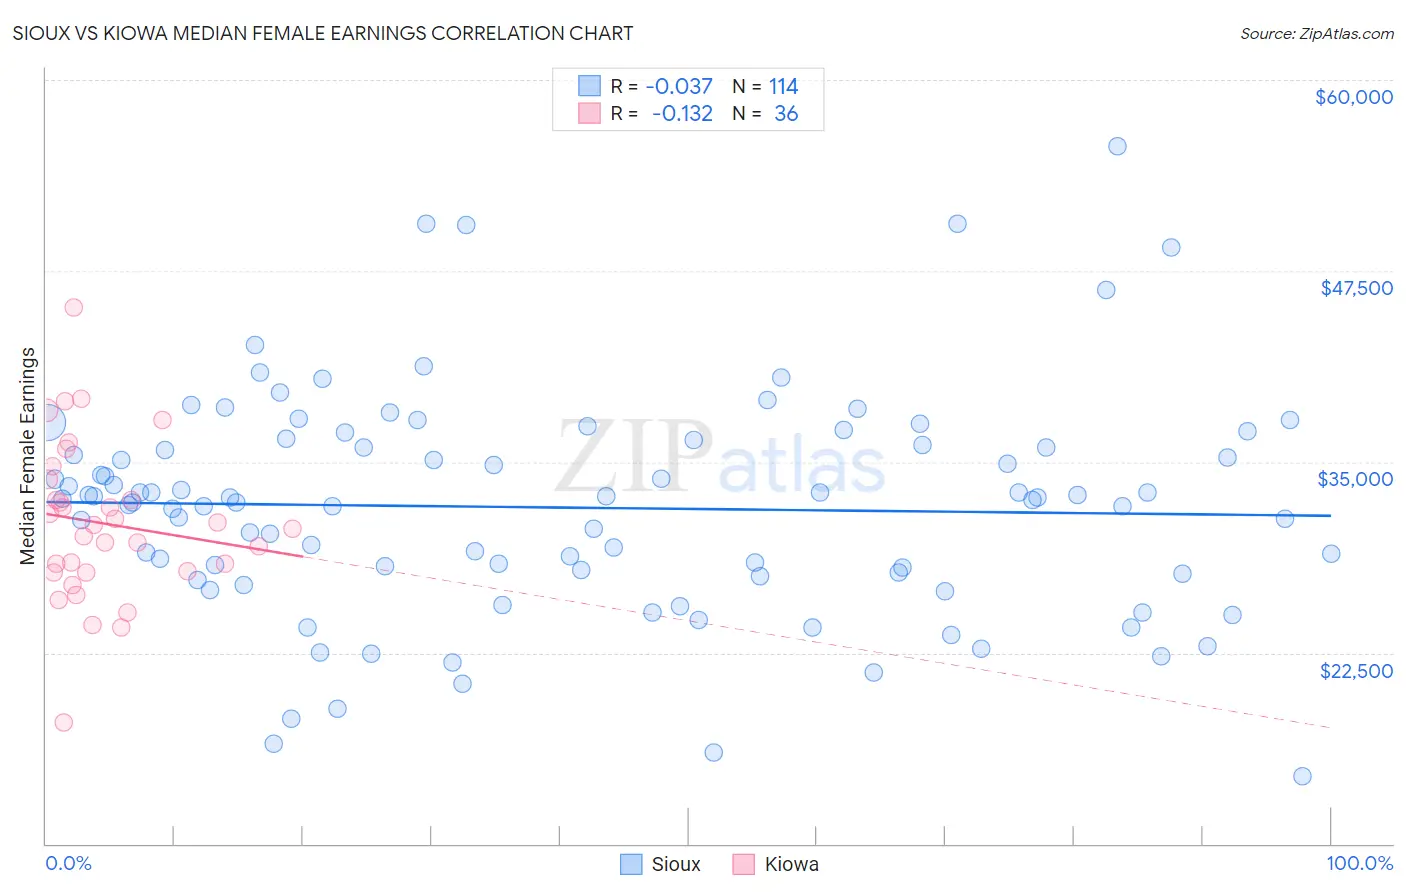
Sioux vs Kiowa Median Female Earnings Correlation Chart
The statistical analysis conducted on geographies consisting of 234,051,020 people shows no correlation between the proportion of Sioux and median female earnings in the United States with a correlation coefficient (R) of -0.037 and weighted average of $35,063. Similarly, the statistical analysis conducted on geographies consisting of 56,093,569 people shows a poor negative correlation between the proportion of Kiowa and median female earnings in the United States with a correlation coefficient (R) of -0.132 and weighted average of $34,074, a difference of 2.9%.
Median Female Earnings Correlation Summary
| Measurement | Sioux | Kiowa |
| Minimum | $14,387 | $17,933 |
| Maximum | $55,625 | $45,071 |
| Range | $41,238 | $27,137 |
| Mean | $32,005 | $30,965 |
| Median | $32,537 | $30,714 |
| Interquartile 25% (IQ1) | $27,692 | $27,790 |
| Interquartile 75% (IQ3) | $36,094 | $33,181 |
| Interquartile Range (IQR) | $8,402 | $5,391 |
| Standard Deviation (Sample) | $7,319 | $5,151 |
| Standard Deviation (Population) | $7,287 | $5,079 |
Demographics Similar to Sioux and Kiowa by Median Female Earnings
In terms of median female earnings, the demographic groups most similar to Sioux are Immigrants from Bahamas ($35,027, a difference of 0.10%), Honduran ($35,013, a difference of 0.14%), Fijian ($35,114, a difference of 0.15%), Chippewa ($35,003, a difference of 0.17%), and Ute ($34,960, a difference of 0.29%). Similarly, the demographic groups most similar to Kiowa are Dutch West Indian ($34,106, a difference of 0.090%), Immigrants from Congo ($34,317, a difference of 0.71%), Seminole ($34,385, a difference of 0.91%), Chickasaw ($34,414, a difference of 1.0%), and Hispanic or Latino ($34,421, a difference of 1.0%).
| Demographics | Rating | Rank | Median Female Earnings |
| Fijians | 0.0 /100 | #306 | Tragic $35,114 |
| Sioux | 0.0 /100 | #307 | Tragic $35,063 |
| Immigrants | Bahamas | 0.0 /100 | #308 | Tragic $35,027 |
| Hondurans | 0.0 /100 | #309 | Tragic $35,013 |
| Chippewa | 0.0 /100 | #310 | Tragic $35,003 |
| Ute | 0.0 /100 | #311 | Tragic $34,960 |
| Yaqui | 0.0 /100 | #312 | Tragic $34,943 |
| Cubans | 0.0 /100 | #313 | Tragic $34,942 |
| Apache | 0.0 /100 | #314 | Tragic $34,895 |
| Pennsylvania Germans | 0.0 /100 | #315 | Tragic $34,802 |
| Cherokee | 0.0 /100 | #316 | Tragic $34,742 |
| Potawatomi | 0.0 /100 | #317 | Tragic $34,739 |
| Immigrants | Yemen | 0.0 /100 | #318 | Tragic $34,693 |
| Shoshone | 0.0 /100 | #319 | Tragic $34,677 |
| Immigrants | Honduras | 0.0 /100 | #320 | Tragic $34,647 |
| Hispanics or Latinos | 0.0 /100 | #321 | Tragic $34,421 |
| Chickasaw | 0.0 /100 | #322 | Tragic $34,414 |
| Seminole | 0.0 /100 | #323 | Tragic $34,385 |
| Immigrants | Congo | 0.0 /100 | #324 | Tragic $34,317 |
| Dutch West Indians | 0.0 /100 | #325 | Tragic $34,106 |
| Kiowa | 0.0 /100 | #326 | Tragic $34,074 |