Immigrants from Uruguay vs Kiowa No Vehicles in Household
COMPARE
Immigrants from Uruguay
Kiowa
No Vehicles in Household
No Vehicles in Household Comparison
Immigrants from Uruguay
Kiowa
11.9%
NO VEHICLES IN HOUSEHOLD
1.3/ 100
METRIC RATING
254th/ 347
METRIC RANK
11.5%
NO VEHICLES IN HOUSEHOLD
4.0/ 100
METRIC RATING
235th/ 347
METRIC RANK
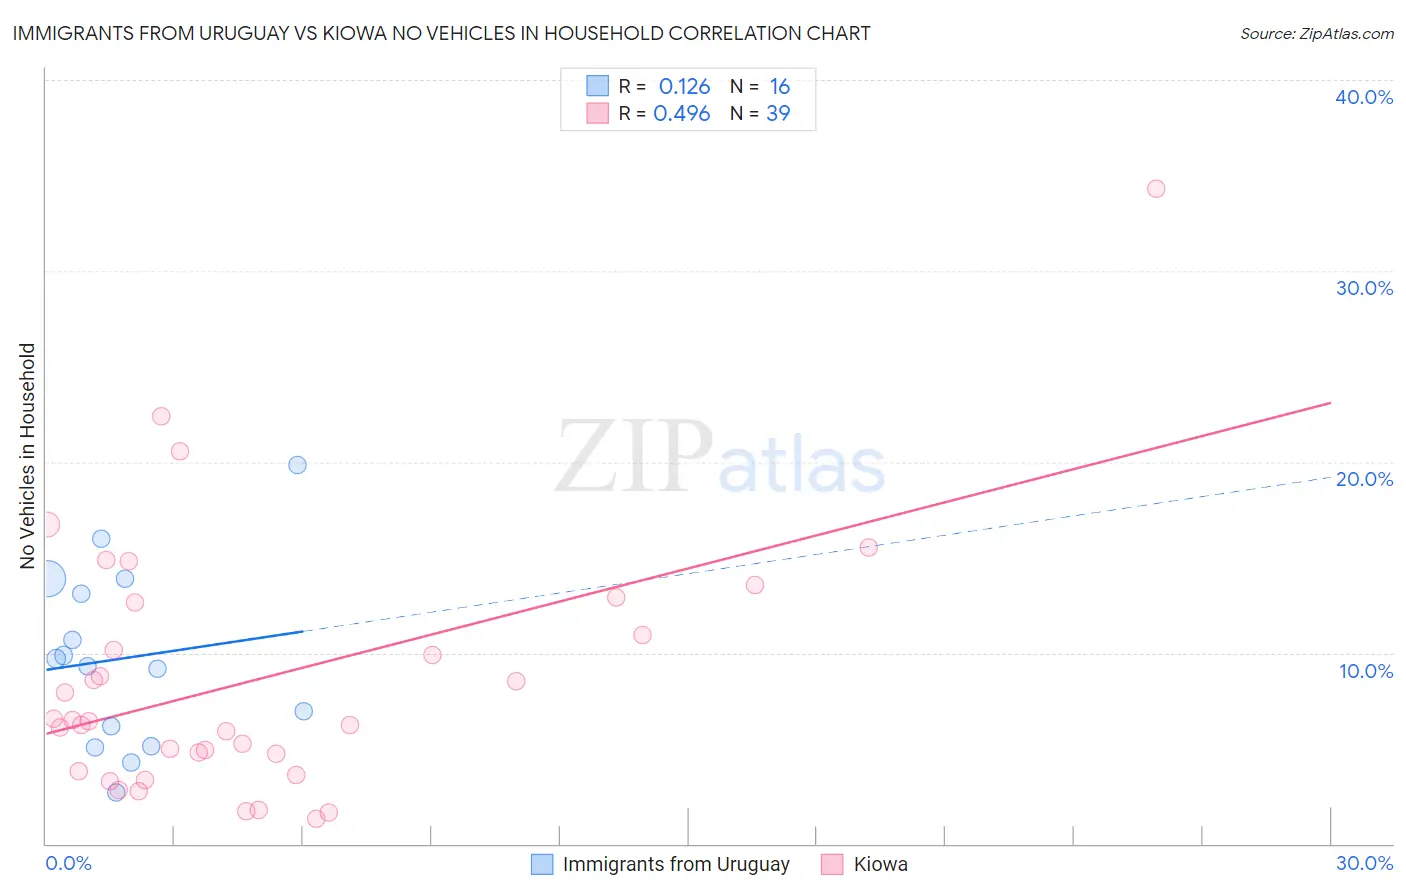
Immigrants from Uruguay vs Kiowa No Vehicles in Household Correlation Chart
The statistical analysis conducted on geographies consisting of 133,161,139 people shows a poor positive correlation between the proportion of Immigrants from Uruguay and percentage of households with no vehicle available in the United States with a correlation coefficient (R) of 0.126 and weighted average of 11.9%. Similarly, the statistical analysis conducted on geographies consisting of 56,075,715 people shows a moderate positive correlation between the proportion of Kiowa and percentage of households with no vehicle available in the United States with a correlation coefficient (R) of 0.496 and weighted average of 11.5%, a difference of 3.5%.
No Vehicles in Household Correlation Summary
| Measurement | Immigrants from Uruguay | Kiowa |
| Minimum | 2.7% | 1.3% |
| Maximum | 19.8% | 34.3% |
| Range | 17.2% | 33.0% |
| Mean | 9.7% | 8.7% |
| Median | 9.5% | 6.4% |
| Interquartile 25% (IQ1) | 5.6% | 3.8% |
| Interquartile 75% (IQ3) | 13.5% | 12.7% |
| Interquartile Range (IQR) | 7.9% | 8.8% |
| Standard Deviation (Sample) | 4.7% | 6.7% |
| Standard Deviation (Population) | 4.6% | 6.7% |
Demographics Similar to Immigrants from Uruguay and Kiowa by No Vehicles in Household
In terms of no vehicles in household, the demographic groups most similar to Immigrants from Uruguay are Egyptian (11.9%, a difference of 0.32%), Immigrants from Serbia (11.9%, a difference of 0.39%), Black/African American (11.9%, a difference of 0.65%), Paiute (11.8%, a difference of 1.0%), and Immigrants from Nigeria (11.8%, a difference of 1.2%). Similarly, the demographic groups most similar to Kiowa are Cree (11.6%, a difference of 0.35%), Immigrants from Peru (11.5%, a difference of 0.38%), Ute (11.6%, a difference of 0.59%), Russian (11.6%, a difference of 0.64%), and Taiwanese (11.7%, a difference of 1.1%).
| Demographics | Rating | Rank | No Vehicles in Household |
| Immigrants | Peru | 4.5 /100 | #234 | Tragic 11.5% |
| Kiowa | 4.0 /100 | #235 | Tragic 11.5% |
| Cree | 3.5 /100 | #236 | Tragic 11.6% |
| Ute | 3.3 /100 | #237 | Tragic 11.6% |
| Russians | 3.2 /100 | #238 | Tragic 11.6% |
| Taiwanese | 2.8 /100 | #239 | Tragic 11.7% |
| Immigrants | Immigrants | 2.7 /100 | #240 | Tragic 11.7% |
| Eastern Europeans | 2.7 /100 | #241 | Tragic 11.7% |
| Turks | 2.6 /100 | #242 | Tragic 11.7% |
| Cheyenne | 2.4 /100 | #243 | Tragic 11.7% |
| Immigrants | Portugal | 2.2 /100 | #244 | Tragic 11.7% |
| Immigrants | Honduras | 2.1 /100 | #245 | Tragic 11.8% |
| Menominee | 2.0 /100 | #246 | Tragic 11.8% |
| Immigrants | Czechoslovakia | 2.0 /100 | #247 | Tragic 11.8% |
| Immigrants | Belgium | 1.9 /100 | #248 | Tragic 11.8% |
| Immigrants | Nigeria | 1.9 /100 | #249 | Tragic 11.8% |
| Paiute | 1.8 /100 | #250 | Tragic 11.8% |
| Blacks/African Americans | 1.6 /100 | #251 | Tragic 11.9% |
| Immigrants | Serbia | 1.5 /100 | #252 | Tragic 11.9% |
| Egyptians | 1.4 /100 | #253 | Tragic 11.9% |
| Immigrants | Uruguay | 1.3 /100 | #254 | Tragic 11.9% |