Seminole vs Immigrants from Europe Householder Income Ages 45 - 64 years
COMPARE
Seminole
Immigrants from Europe
Householder Income Ages 45 - 64 years
Householder Income Ages 45 - 64 years Comparison
Seminole
Immigrants from Europe
$80,077
HOUSEHOLDER INCOME AGES 45 - 64 YEARS
0.0/ 100
METRIC RATING
327th/ 347
METRIC RANK
$111,984
HOUSEHOLDER INCOME AGES 45 - 64 YEARS
99.7/ 100
METRIC RATING
59th/ 347
METRIC RANK
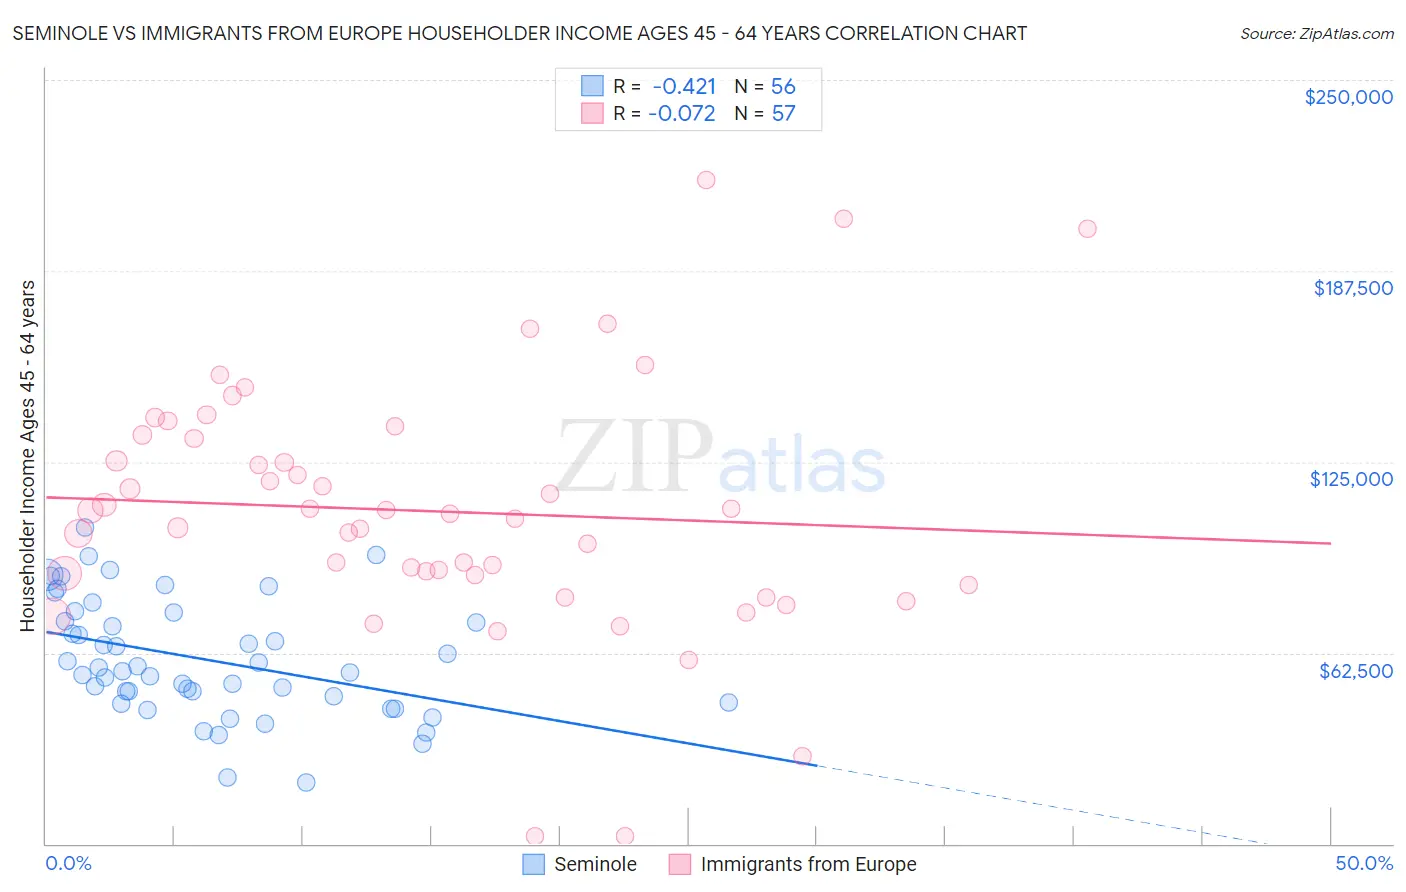
Seminole vs Immigrants from Europe Householder Income Ages 45 - 64 years Correlation Chart
The statistical analysis conducted on geographies consisting of 118,234,136 people shows a moderate negative correlation between the proportion of Seminole and household income with householder between the ages 45 and 64 in the United States with a correlation coefficient (R) of -0.421 and weighted average of $80,077. Similarly, the statistical analysis conducted on geographies consisting of 544,996,664 people shows a slight negative correlation between the proportion of Immigrants from Europe and household income with householder between the ages 45 and 64 in the United States with a correlation coefficient (R) of -0.072 and weighted average of $111,984, a difference of 39.9%.
Householder Income Ages 45 - 64 years Correlation Summary
| Measurement | Seminole | Immigrants from Europe |
| Minimum | $20,000 | $2,499 |
| Maximum | $103,357 | $217,188 |
| Range | $83,357 | $214,689 |
| Mean | $60,470 | $108,826 |
| Median | $57,012 | $107,861 |
| Interquartile 25% (IQ1) | $47,308 | $86,440 |
| Interquartile 75% (IQ3) | $74,206 | $133,222 |
| Interquartile Range (IQR) | $26,898 | $46,781 |
| Standard Deviation (Sample) | $19,035 | $41,229 |
| Standard Deviation (Population) | $18,864 | $40,866 |
Similar Demographics by Householder Income Ages 45 - 64 years
Demographics Similar to Seminole by Householder Income Ages 45 - 64 years
In terms of householder income ages 45 - 64 years, the demographic groups most similar to Seminole are Native/Alaskan ($79,816, a difference of 0.33%), Dominican ($80,623, a difference of 0.68%), Immigrants from Cuba ($80,662, a difference of 0.73%), Yup'ik ($81,000, a difference of 1.1%), and Dutch West Indian ($79,171, a difference of 1.1%).
| Demographics | Rating | Rank | Householder Income Ages 45 - 64 years |
| Apache | 0.0 /100 | #320 | Tragic $82,184 |
| Yuman | 0.0 /100 | #321 | Tragic $82,139 |
| Sioux | 0.0 /100 | #322 | Tragic $81,750 |
| Bahamians | 0.0 /100 | #323 | Tragic $81,369 |
| Yup'ik | 0.0 /100 | #324 | Tragic $81,000 |
| Immigrants | Cuba | 0.0 /100 | #325 | Tragic $80,662 |
| Dominicans | 0.0 /100 | #326 | Tragic $80,623 |
| Seminole | 0.0 /100 | #327 | Tragic $80,077 |
| Natives/Alaskans | 0.0 /100 | #328 | Tragic $79,816 |
| Dutch West Indians | 0.0 /100 | #329 | Tragic $79,171 |
| Creek | 0.0 /100 | #330 | Tragic $78,960 |
| Immigrants | Dominican Republic | 0.0 /100 | #331 | Tragic $78,836 |
| Blacks/African Americans | 0.0 /100 | #332 | Tragic $78,556 |
| Immigrants | Congo | 0.0 /100 | #333 | Tragic $77,850 |
| Menominee | 0.0 /100 | #334 | Tragic $76,903 |
Demographics Similar to Immigrants from Europe by Householder Income Ages 45 - 64 years
In terms of householder income ages 45 - 64 years, the demographic groups most similar to Immigrants from Europe are Immigrants from Netherlands ($111,982, a difference of 0.0%), Soviet Union ($112,008, a difference of 0.020%), Immigrants from Czechoslovakia ($111,914, a difference of 0.060%), Immigrants from Scotland ($112,175, a difference of 0.17%), and Egyptian ($112,256, a difference of 0.24%).
| Demographics | Rating | Rank | Householder Income Ages 45 - 64 years |
| Immigrants | Malaysia | 99.8 /100 | #52 | Exceptional $112,796 |
| Afghans | 99.8 /100 | #53 | Exceptional $112,676 |
| Greeks | 99.8 /100 | #54 | Exceptional $112,630 |
| Lithuanians | 99.8 /100 | #55 | Exceptional $112,484 |
| Egyptians | 99.7 /100 | #56 | Exceptional $112,256 |
| Immigrants | Scotland | 99.7 /100 | #57 | Exceptional $112,175 |
| Soviet Union | 99.7 /100 | #58 | Exceptional $112,008 |
| Immigrants | Europe | 99.7 /100 | #59 | Exceptional $111,984 |
| Immigrants | Netherlands | 99.7 /100 | #60 | Exceptional $111,982 |
| Immigrants | Czechoslovakia | 99.7 /100 | #61 | Exceptional $111,914 |
| Immigrants | Norway | 99.7 /100 | #62 | Exceptional $111,669 |
| Mongolians | 99.6 /100 | #63 | Exceptional $111,602 |
| Immigrants | Latvia | 99.6 /100 | #64 | Exceptional $111,454 |
| Immigrants | Belarus | 99.6 /100 | #65 | Exceptional $111,430 |
| New Zealanders | 99.6 /100 | #66 | Exceptional $111,286 |