Samoan vs Trinidadian and Tobagonian 4th Grade
COMPARE
Samoan
Trinidadian and Tobagonian
4th Grade
4th Grade Comparison
Samoans
Trinidadians and Tobagonians
97.3%
4TH GRADE
6.8/ 100
METRIC RATING
216th/ 347
METRIC RANK
96.9%
4TH GRADE
0.1/ 100
METRIC RATING
274th/ 347
METRIC RANK
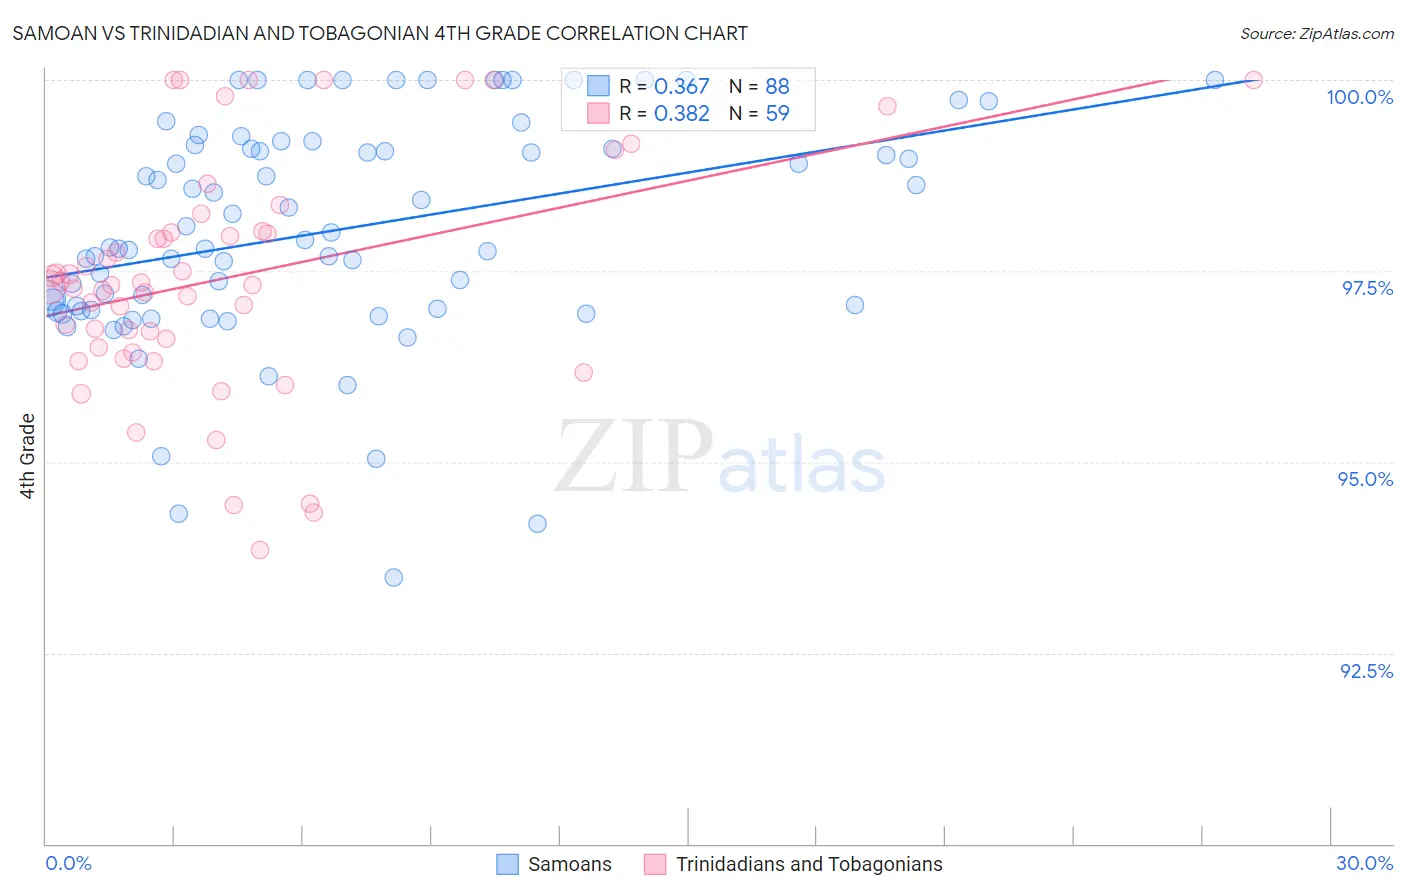
Samoan vs Trinidadian and Tobagonian 4th Grade Correlation Chart
The statistical analysis conducted on geographies consisting of 225,205,818 people shows a mild positive correlation between the proportion of Samoans and percentage of population with at least 4th grade education in the United States with a correlation coefficient (R) of 0.367 and weighted average of 97.3%. Similarly, the statistical analysis conducted on geographies consisting of 219,882,819 people shows a mild positive correlation between the proportion of Trinidadians and Tobagonians and percentage of population with at least 4th grade education in the United States with a correlation coefficient (R) of 0.382 and weighted average of 96.9%, a difference of 0.40%.
4th Grade Correlation Summary
| Measurement | Samoan | Trinidadian and Tobagonian |
| Minimum | 93.5% | 93.8% |
| Maximum | 100.0% | 100.0% |
| Range | 6.5% | 6.2% |
| Mean | 98.0% | 97.4% |
| Median | 97.9% | 97.3% |
| Interquartile 25% (IQ1) | 97.0% | 96.5% |
| Interquartile 75% (IQ3) | 99.1% | 98.0% |
| Interquartile Range (IQR) | 2.1% | 1.5% |
| Standard Deviation (Sample) | 1.5% | 1.5% |
| Standard Deviation (Population) | 1.5% | 1.5% |
Similar Demographics by 4th Grade
Demographics Similar to Samoans by 4th Grade
In terms of 4th grade, the demographic groups most similar to Samoans are Immigrants from Morocco (97.3%, a difference of 0.0%), Sierra Leonean (97.3%, a difference of 0.0%), Immigrants from Nepal (97.3%, a difference of 0.010%), Iraqi (97.3%, a difference of 0.010%), and Tohono O'odham (97.3%, a difference of 0.020%).
| Demographics | Rating | Rank | 4th Grade |
| Laotians | 9.3 /100 | #209 | Tragic 97.3% |
| Immigrants | Oceania | 9.1 /100 | #210 | Tragic 97.3% |
| Sudanese | 9.0 /100 | #211 | Tragic 97.3% |
| Tohono O'odham | 8.4 /100 | #212 | Tragic 97.3% |
| Costa Ricans | 8.3 /100 | #213 | Tragic 97.3% |
| Immigrants | Nepal | 7.7 /100 | #214 | Tragic 97.3% |
| Immigrants | Morocco | 7.1 /100 | #215 | Tragic 97.3% |
| Samoans | 6.8 /100 | #216 | Tragic 97.3% |
| Sierra Leoneans | 6.5 /100 | #217 | Tragic 97.3% |
| Iraqis | 6.3 /100 | #218 | Tragic 97.3% |
| Tongans | 5.8 /100 | #219 | Tragic 97.3% |
| South American Indians | 5.5 /100 | #220 | Tragic 97.3% |
| Immigrants | Panama | 5.4 /100 | #221 | Tragic 97.3% |
| Immigrants | Lebanon | 5.1 /100 | #222 | Tragic 97.3% |
| Immigrants | Sudan | 5.0 /100 | #223 | Tragic 97.2% |
Demographics Similar to Trinidadians and Tobagonians by 4th Grade
In terms of 4th grade, the demographic groups most similar to Trinidadians and Tobagonians are Fijian (96.9%, a difference of 0.010%), Immigrants from Cameroon (96.9%, a difference of 0.010%), Immigrants from Ghana (96.9%, a difference of 0.010%), Yaqui (96.9%, a difference of 0.010%), and Immigrants from Western Africa (96.9%, a difference of 0.010%).
| Demographics | Rating | Rank | 4th Grade |
| Immigrants | Nigeria | 0.3 /100 | #267 | Tragic 97.0% |
| Ghanaians | 0.2 /100 | #268 | Tragic 97.0% |
| Immigrants | Uzbekistan | 0.2 /100 | #269 | Tragic 96.9% |
| Cubans | 0.2 /100 | #270 | Tragic 96.9% |
| Immigrants | Peru | 0.1 /100 | #271 | Tragic 96.9% |
| Fijians | 0.1 /100 | #272 | Tragic 96.9% |
| Immigrants | Cameroon | 0.1 /100 | #273 | Tragic 96.9% |
| Trinidadians and Tobagonians | 0.1 /100 | #274 | Tragic 96.9% |
| Immigrants | Ghana | 0.1 /100 | #275 | Tragic 96.9% |
| Yaqui | 0.1 /100 | #276 | Tragic 96.9% |
| Immigrants | Western Africa | 0.1 /100 | #277 | Tragic 96.9% |
| Immigrants | Bolivia | 0.1 /100 | #278 | Tragic 96.9% |
| Afghans | 0.1 /100 | #279 | Tragic 96.9% |
| Barbadians | 0.1 /100 | #280 | Tragic 96.9% |
| Immigrants | Hong Kong | 0.1 /100 | #281 | Tragic 96.9% |