Romanian vs Scotch-Irish Seniors Poverty Over the Age of 65
COMPARE
Romanian
Scotch-Irish
Seniors Poverty Over the Age of 65
Seniors Poverty Over the Age of 65 Comparison
Romanians
Scotch-Irish
10.1%
SENIORS POVERTY OVER THE AGE OF 65
97.2/ 100
METRIC RATING
86th/ 347
METRIC RANK
9.5%
SENIORS POVERTY OVER THE AGE OF 65
99.7/ 100
METRIC RATING
37th/ 347
METRIC RANK
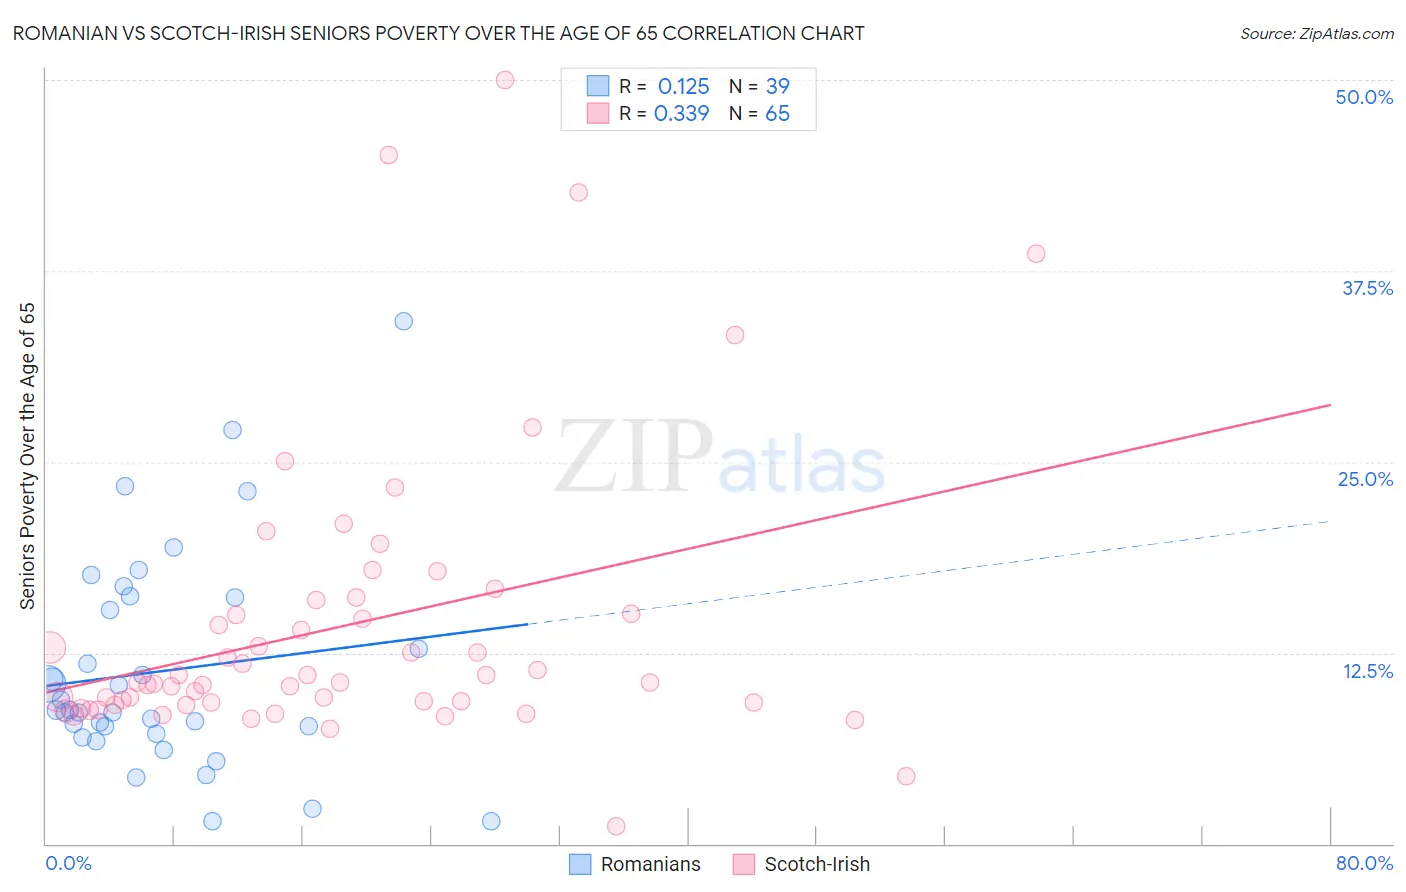
Romanian vs Scotch-Irish Seniors Poverty Over the Age of 65 Correlation Chart
The statistical analysis conducted on geographies consisting of 376,686,002 people shows a poor positive correlation between the proportion of Romanians and poverty level among seniors over the age of 65 in the United States with a correlation coefficient (R) of 0.125 and weighted average of 10.1%. Similarly, the statistical analysis conducted on geographies consisting of 544,466,236 people shows a mild positive correlation between the proportion of Scotch-Irish and poverty level among seniors over the age of 65 in the United States with a correlation coefficient (R) of 0.339 and weighted average of 9.5%, a difference of 6.0%.
Seniors Poverty Over the Age of 65 Correlation Summary
| Measurement | Romanian | Scotch-Irish |
| Minimum | 1.4% | 1.1% |
| Maximum | 34.2% | 50.0% |
| Range | 32.7% | 48.9% |
| Mean | 11.3% | 14.3% |
| Median | 8.7% | 10.5% |
| Interquartile 25% (IQ1) | 7.2% | 9.2% |
| Interquartile 75% (IQ3) | 16.1% | 15.5% |
| Interquartile Range (IQR) | 8.9% | 6.3% |
| Standard Deviation (Sample) | 7.1% | 9.4% |
| Standard Deviation (Population) | 7.0% | 9.3% |
Similar Demographics by Seniors Poverty Over the Age of 65
Demographics Similar to Romanians by Seniors Poverty Over the Age of 65
In terms of seniors poverty over the age of 65, the demographic groups most similar to Romanians are Immigrants from Afghanistan (10.1%, a difference of 0.020%), Immigrants from Nepal (10.1%, a difference of 0.020%), Burmese (10.1%, a difference of 0.020%), Immigrants from Poland (10.1%, a difference of 0.050%), and Immigrants from Bolivia (10.1%, a difference of 0.070%).
| Demographics | Rating | Rank | Seniors Poverty Over the Age of 65 |
| Immigrants | Ireland | 97.5 /100 | #79 | Exceptional 10.0% |
| Koreans | 97.4 /100 | #80 | Exceptional 10.1% |
| Immigrants | Sri Lanka | 97.3 /100 | #81 | Exceptional 10.1% |
| Immigrants | Bolivia | 97.3 /100 | #82 | Exceptional 10.1% |
| Immigrants | Poland | 97.2 /100 | #83 | Exceptional 10.1% |
| Immigrants | Afghanistan | 97.2 /100 | #84 | Exceptional 10.1% |
| Immigrants | Nepal | 97.2 /100 | #85 | Exceptional 10.1% |
| Romanians | 97.2 /100 | #86 | Exceptional 10.1% |
| Burmese | 97.2 /100 | #87 | Exceptional 10.1% |
| Jordanians | 97.1 /100 | #88 | Exceptional 10.1% |
| Immigrants | Bulgaria | 97.0 /100 | #89 | Exceptional 10.1% |
| Ukrainians | 96.9 /100 | #90 | Exceptional 10.1% |
| Puget Sound Salish | 96.9 /100 | #91 | Exceptional 10.1% |
| Immigrants | Singapore | 96.9 /100 | #92 | Exceptional 10.1% |
| Immigrants | Sweden | 96.7 /100 | #93 | Exceptional 10.1% |
Demographics Similar to Scotch-Irish by Seniors Poverty Over the Age of 65
In terms of seniors poverty over the age of 65, the demographic groups most similar to Scotch-Irish are Belgian (9.5%, a difference of 0.020%), Czechoslovakian (9.5%, a difference of 0.50%), Latvian (9.5%, a difference of 0.55%), Greek (9.6%, a difference of 0.65%), and Assyrian/Chaldean/Syriac (9.6%, a difference of 0.77%).
| Demographics | Rating | Rank | Seniors Poverty Over the Age of 65 |
| Menominee | 99.8 /100 | #30 | Exceptional 9.4% |
| Finns | 99.8 /100 | #31 | Exceptional 9.4% |
| Northern Europeans | 99.8 /100 | #32 | Exceptional 9.4% |
| Native Hawaiians | 99.8 /100 | #33 | Exceptional 9.4% |
| British | 99.8 /100 | #34 | Exceptional 9.4% |
| Latvians | 99.8 /100 | #35 | Exceptional 9.5% |
| Czechoslovakians | 99.8 /100 | #36 | Exceptional 9.5% |
| Scotch-Irish | 99.7 /100 | #37 | Exceptional 9.5% |
| Belgians | 99.7 /100 | #38 | Exceptional 9.5% |
| Greeks | 99.6 /100 | #39 | Exceptional 9.6% |
| Assyrians/Chaldeans/Syriacs | 99.6 /100 | #40 | Exceptional 9.6% |
| Immigrants | North Macedonia | 99.6 /100 | #41 | Exceptional 9.6% |
| Zimbabweans | 99.6 /100 | #42 | Exceptional 9.6% |
| Eastern Europeans | 99.6 /100 | #43 | Exceptional 9.6% |
| Austrians | 99.5 /100 | #44 | Exceptional 9.6% |