Puget Sound Salish vs Immigrants from Northern Europe Single Mother Households
COMPARE
Puget Sound Salish
Immigrants from Northern Europe
Single Mother Households
Single Mother Households Comparison
Puget Sound Salish
Immigrants from Northern Europe
6.3%
SINGLE MOTHER HOUSEHOLDS
58.1/ 100
METRIC RATING
169th/ 347
METRIC RANK
5.3%
SINGLE MOTHER HOUSEHOLDS
99.7/ 100
METRIC RATING
35th/ 347
METRIC RANK
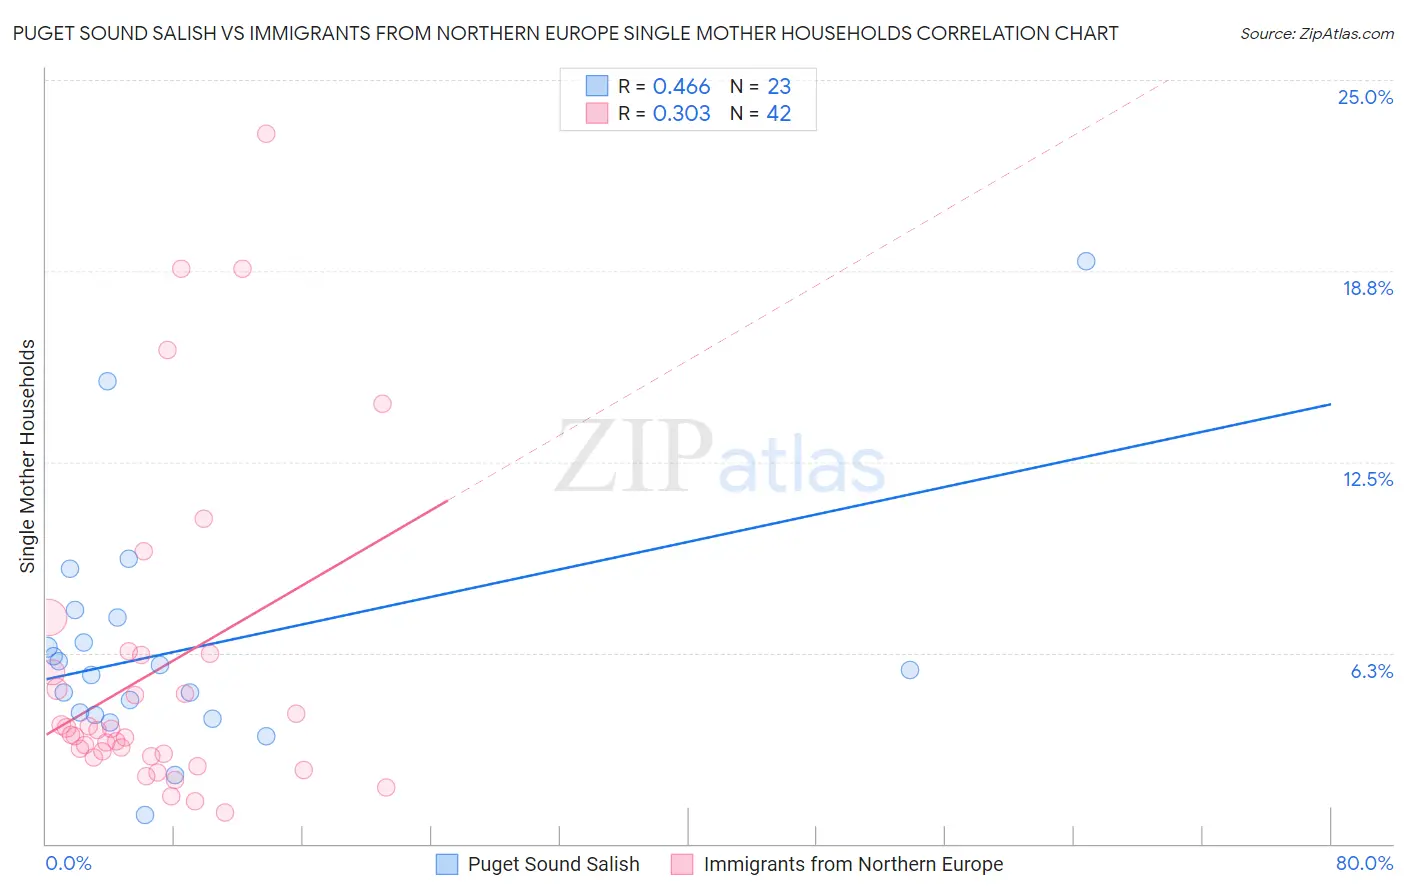
Puget Sound Salish vs Immigrants from Northern Europe Single Mother Households Correlation Chart
The statistical analysis conducted on geographies consisting of 46,127,727 people shows a moderate positive correlation between the proportion of Puget Sound Salish and percentage of single mother households in the United States with a correlation coefficient (R) of 0.466 and weighted average of 6.3%. Similarly, the statistical analysis conducted on geographies consisting of 474,819,920 people shows a mild positive correlation between the proportion of Immigrants from Northern Europe and percentage of single mother households in the United States with a correlation coefficient (R) of 0.303 and weighted average of 5.3%, a difference of 17.7%.
Single Mother Households Correlation Summary
| Measurement | Puget Sound Salish | Immigrants from Northern Europe |
| Minimum | 0.93% | 1.0% |
| Maximum | 19.0% | 23.2% |
| Range | 18.1% | 22.2% |
| Mean | 6.4% | 5.6% |
| Median | 5.7% | 3.6% |
| Interquartile 25% (IQ1) | 4.2% | 2.9% |
| Interquartile 75% (IQ3) | 7.4% | 6.2% |
| Interquartile Range (IQR) | 3.2% | 3.3% |
| Standard Deviation (Sample) | 3.9% | 5.2% |
| Standard Deviation (Population) | 3.8% | 5.1% |
Similar Demographics by Single Mother Households
Demographics Similar to Puget Sound Salish by Single Mother Households
In terms of single mother households, the demographic groups most similar to Puget Sound Salish are Immigrants from Chile (6.3%, a difference of 0.020%), Brazilian (6.2%, a difference of 0.11%), Immigrants from Oceania (6.3%, a difference of 0.40%), Afghan (6.3%, a difference of 0.63%), and Immigrants from South Eastern Asia (6.3%, a difference of 0.66%).
| Demographics | Rating | Rank | Single Mother Households |
| Immigrants | Zimbabwe | 69.9 /100 | #162 | Good 6.2% |
| Alsatians | 68.7 /100 | #163 | Good 6.2% |
| Immigrants | Northern Africa | 68.0 /100 | #164 | Good 6.2% |
| Immigrants | Syria | 67.4 /100 | #165 | Good 6.2% |
| Sri Lankans | 63.9 /100 | #166 | Good 6.2% |
| Brazilians | 59.1 /100 | #167 | Average 6.2% |
| Immigrants | Chile | 58.3 /100 | #168 | Average 6.3% |
| Puget Sound Salish | 58.1 /100 | #169 | Average 6.3% |
| Immigrants | Oceania | 54.6 /100 | #170 | Average 6.3% |
| Afghans | 52.5 /100 | #171 | Average 6.3% |
| Immigrants | South Eastern Asia | 52.2 /100 | #172 | Average 6.3% |
| Immigrants | Vietnam | 51.5 /100 | #173 | Average 6.3% |
| Immigrants | Morocco | 50.0 /100 | #174 | Average 6.3% |
| Marshallese | 45.8 /100 | #175 | Average 6.3% |
| Immigrants | Bosnia and Herzegovina | 44.3 /100 | #176 | Average 6.3% |
Demographics Similar to Immigrants from Northern Europe by Single Mother Households
In terms of single mother households, the demographic groups most similar to Immigrants from Northern Europe are Bulgarian (5.3%, a difference of 0.040%), Immigrants from Switzerland (5.3%, a difference of 0.060%), Immigrants from Czechoslovakia (5.3%, a difference of 0.20%), Immigrants from Belgium (5.3%, a difference of 0.35%), and Cambodian (5.3%, a difference of 0.44%).
| Demographics | Rating | Rank | Single Mother Households |
| Russians | 99.7 /100 | #28 | Exceptional 5.3% |
| Latvians | 99.7 /100 | #29 | Exceptional 5.3% |
| Burmese | 99.7 /100 | #30 | Exceptional 5.3% |
| Immigrants | Korea | 99.7 /100 | #31 | Exceptional 5.3% |
| Cambodians | 99.7 /100 | #32 | Exceptional 5.3% |
| Immigrants | Switzerland | 99.7 /100 | #33 | Exceptional 5.3% |
| Bulgarians | 99.7 /100 | #34 | Exceptional 5.3% |
| Immigrants | Northern Europe | 99.7 /100 | #35 | Exceptional 5.3% |
| Immigrants | Czechoslovakia | 99.7 /100 | #36 | Exceptional 5.3% |
| Immigrants | Belgium | 99.7 /100 | #37 | Exceptional 5.3% |
| Immigrants | Serbia | 99.6 /100 | #38 | Exceptional 5.4% |
| Immigrants | Sweden | 99.6 /100 | #39 | Exceptional 5.4% |
| Estonians | 99.6 /100 | #40 | Exceptional 5.4% |
| Immigrants | Greece | 99.5 /100 | #41 | Exceptional 5.4% |
| Macedonians | 99.5 /100 | #42 | Exceptional 5.4% |