Immigrants from Congo vs Hopi No Vehicles in Household
COMPARE
Immigrants from Congo
Hopi
No Vehicles in Household
No Vehicles in Household Comparison
Immigrants from Congo
Hopi
10.1%
NO VEHICLES IN HOUSEHOLD
73.0/ 100
METRIC RATING
152nd/ 347
METRIC RANK
13.7%
NO VEHICLES IN HOUSEHOLD
0.0/ 100
METRIC RATING
288th/ 347
METRIC RANK
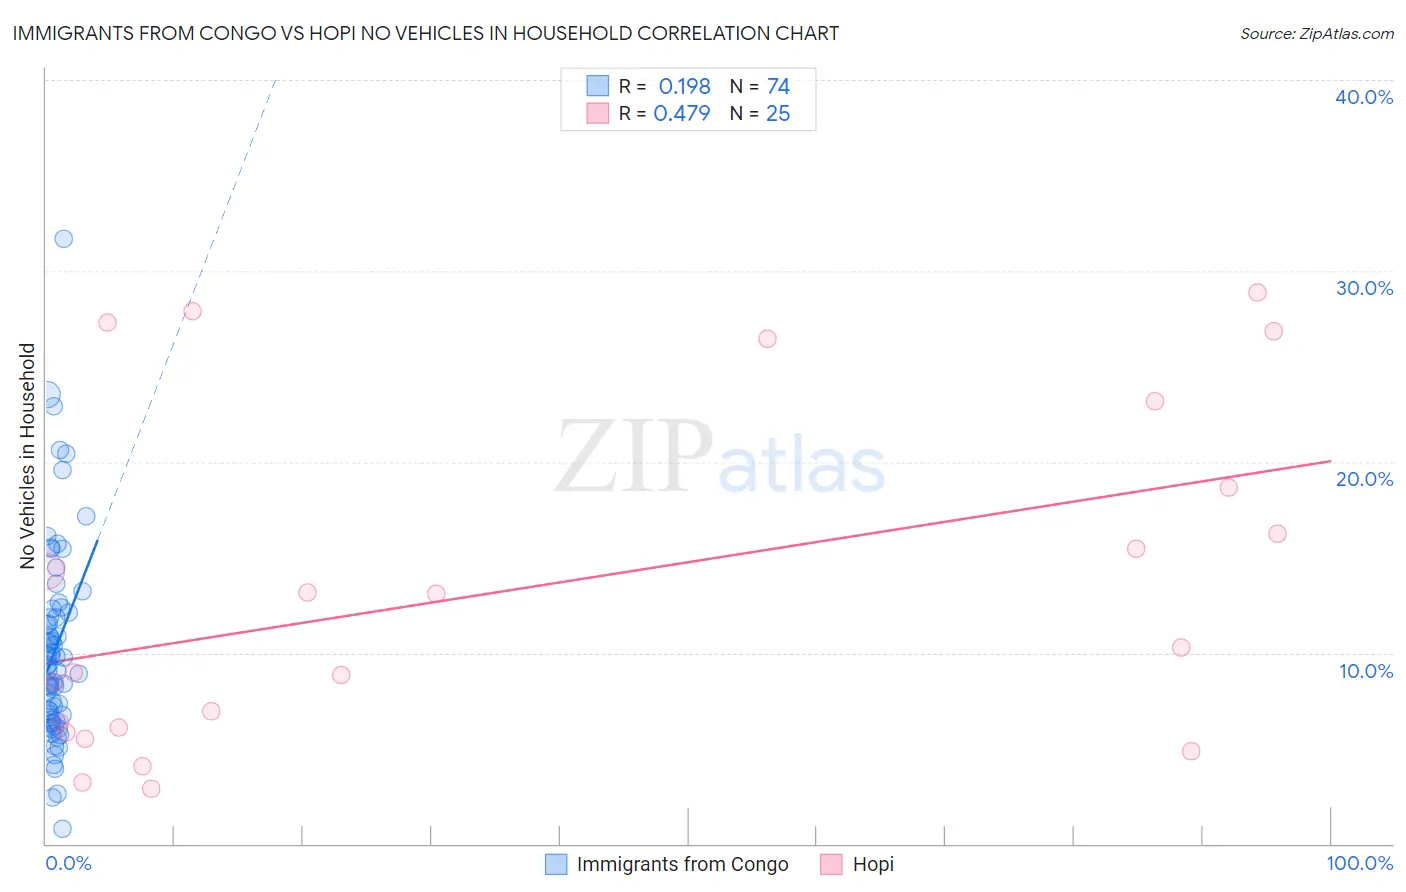
Immigrants from Congo vs Hopi No Vehicles in Household Correlation Chart
The statistical analysis conducted on geographies consisting of 92,060,649 people shows a poor positive correlation between the proportion of Immigrants from Congo and percentage of households with no vehicle available in the United States with a correlation coefficient (R) of 0.198 and weighted average of 10.1%. Similarly, the statistical analysis conducted on geographies consisting of 74,700,452 people shows a moderate positive correlation between the proportion of Hopi and percentage of households with no vehicle available in the United States with a correlation coefficient (R) of 0.479 and weighted average of 13.7%, a difference of 36.6%.
No Vehicles in Household Correlation Summary
| Measurement | Immigrants from Congo | Hopi |
| Minimum | 0.81% | 2.9% |
| Maximum | 31.7% | 28.9% |
| Range | 30.9% | 26.0% |
| Mean | 10.2% | 13.3% |
| Median | 9.2% | 10.2% |
| Interquartile 25% (IQ1) | 6.5% | 5.9% |
| Interquartile 75% (IQ3) | 12.1% | 20.9% |
| Interquartile Range (IQR) | 5.7% | 15.0% |
| Standard Deviation (Sample) | 5.3% | 8.8% |
| Standard Deviation (Population) | 5.2% | 8.6% |
Similar Demographics by No Vehicles in Household
Demographics Similar to Immigrants from Congo by No Vehicles in Household
In terms of no vehicles in household, the demographic groups most similar to Immigrants from Congo are Tlingit-Haida (10.1%, a difference of 0.090%), Sioux (10.1%, a difference of 0.11%), Salvadoran (10.1%, a difference of 0.12%), Immigrants from Eastern Africa (10.0%, a difference of 0.14%), and Colombian (10.0%, a difference of 0.15%).
| Demographics | Rating | Rank | No Vehicles in Household |
| Bahamians | 81.0 /100 | #145 | Excellent 9.9% |
| Hungarians | 80.0 /100 | #146 | Excellent 9.9% |
| Immigrants | Nicaragua | 79.8 /100 | #147 | Good 9.9% |
| Immigrants | Bosnia and Herzegovina | 79.1 /100 | #148 | Good 9.9% |
| Immigrants | Uganda | 76.1 /100 | #149 | Good 10.0% |
| Colombians | 73.9 /100 | #150 | Good 10.0% |
| Immigrants | Eastern Africa | 73.8 /100 | #151 | Good 10.0% |
| Immigrants | Congo | 73.0 /100 | #152 | Good 10.1% |
| Tlingit-Haida | 72.5 /100 | #153 | Good 10.1% |
| Sioux | 72.4 /100 | #154 | Good 10.1% |
| Salvadorans | 72.4 /100 | #155 | Good 10.1% |
| Immigrants | Micronesia | 70.9 /100 | #156 | Good 10.1% |
| Australians | 70.6 /100 | #157 | Good 10.1% |
| Spanish American Indians | 70.2 /100 | #158 | Good 10.1% |
| Immigrants | Indonesia | 69.3 /100 | #159 | Good 10.1% |
Demographics Similar to Hopi by No Vehicles in Household
In terms of no vehicles in household, the demographic groups most similar to Hopi are Immigrants from Ireland (13.7%, a difference of 0.13%), Colville (13.7%, a difference of 0.35%), Immigrants from Australia (13.8%, a difference of 0.66%), Immigrants from Eastern Europe (13.6%, a difference of 1.0%), and Immigrants from Malaysia (13.6%, a difference of 1.1%).
| Demographics | Rating | Rank | No Vehicles in Household |
| Central American Indians | 0.0 /100 | #281 | Tragic 13.3% |
| Immigrants | Eastern Asia | 0.0 /100 | #282 | Tragic 13.5% |
| Immigrants | Kazakhstan | 0.0 /100 | #283 | Tragic 13.6% |
| Immigrants | Malaysia | 0.0 /100 | #284 | Tragic 13.6% |
| Immigrants | Eastern Europe | 0.0 /100 | #285 | Tragic 13.6% |
| Colville | 0.0 /100 | #286 | Tragic 13.7% |
| Immigrants | Ireland | 0.0 /100 | #287 | Tragic 13.7% |
| Hopi | 0.0 /100 | #288 | Tragic 13.7% |
| Immigrants | Australia | 0.0 /100 | #289 | Tragic 13.8% |
| Indians (Asian) | 0.0 /100 | #290 | Tragic 14.1% |
| Okinawans | 0.0 /100 | #291 | Tragic 14.1% |
| Pima | 0.0 /100 | #292 | Tragic 14.1% |
| Immigrants | Jamaica | 0.0 /100 | #293 | Tragic 14.2% |
| Belizeans | 0.0 /100 | #294 | Tragic 14.3% |
| Paraguayans | 0.0 /100 | #295 | Tragic 14.4% |