Potawatomi vs Immigrants from Czechoslovakia 4 or more Vehicles in Household
COMPARE
Potawatomi
Immigrants from Czechoslovakia
4 or more Vehicles in Household
4 or more Vehicles in Household Comparison
Potawatomi
Immigrants from Czechoslovakia
7.3%
4 OR MORE VEHICLES IN HOUSEHOLD
99.7/ 100
METRIC RATING
83rd/ 347
METRIC RANK
5.8%
4 OR MORE VEHICLES IN HOUSEHOLD
3.2/ 100
METRIC RATING
243rd/ 347
METRIC RANK
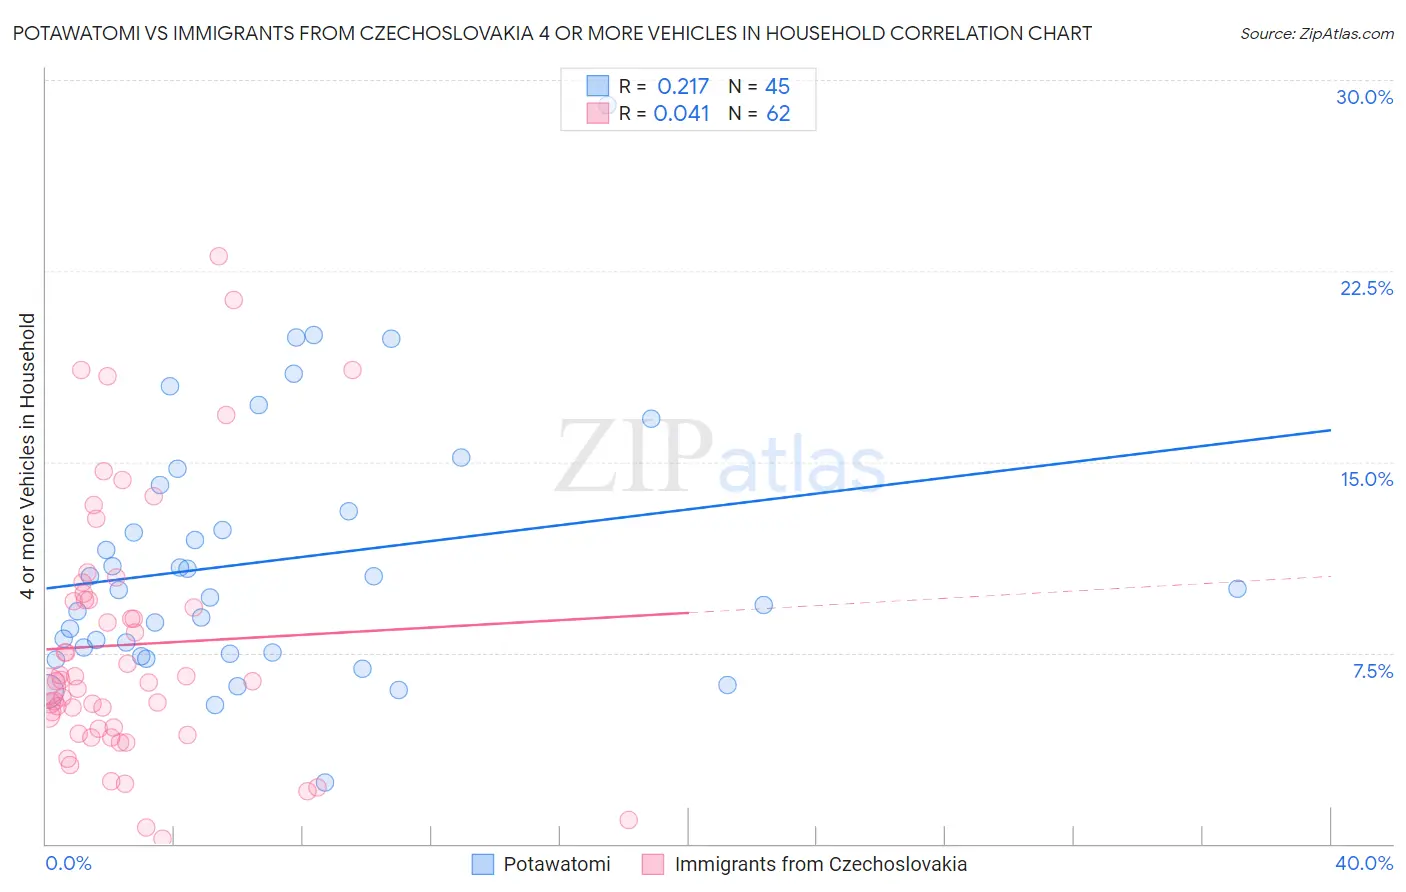
Potawatomi vs Immigrants from Czechoslovakia 4 or more Vehicles in Household Correlation Chart
The statistical analysis conducted on geographies consisting of 117,653,043 people shows a weak positive correlation between the proportion of Potawatomi and percentage of households with 4 or more vehicles available in the United States with a correlation coefficient (R) of 0.217 and weighted average of 7.3%. Similarly, the statistical analysis conducted on geographies consisting of 194,652,046 people shows no correlation between the proportion of Immigrants from Czechoslovakia and percentage of households with 4 or more vehicles available in the United States with a correlation coefficient (R) of 0.041 and weighted average of 5.8%, a difference of 25.9%.
4 or more Vehicles in Household Correlation Summary
| Measurement | Potawatomi | Immigrants from Czechoslovakia |
| Minimum | 2.4% | 0.19% |
| Maximum | 29.0% | 23.1% |
| Range | 26.6% | 22.9% |
| Mean | 11.1% | 7.8% |
| Median | 10.0% | 6.4% |
| Interquartile 25% (IQ1) | 7.5% | 4.5% |
| Interquartile 75% (IQ3) | 13.6% | 9.6% |
| Interquartile Range (IQR) | 6.1% | 5.1% |
| Standard Deviation (Sample) | 5.1% | 5.1% |
| Standard Deviation (Population) | 5.0% | 5.0% |
Similar Demographics by 4 or more Vehicles in Household
Demographics Similar to Potawatomi by 4 or more Vehicles in Household
In terms of 4 or more vehicles in household, the demographic groups most similar to Potawatomi are Northern European (7.3%, a difference of 0.12%), Finnish (7.3%, a difference of 0.32%), Afghan (7.3%, a difference of 0.33%), Cree (7.2%, a difference of 0.49%), and Immigrants from Indonesia (7.2%, a difference of 0.68%).
| Demographics | Rating | Rank | 4 or more Vehicles in Household |
| Laotians | 99.9 /100 | #76 | Exceptional 7.4% |
| Apache | 99.9 /100 | #77 | Exceptional 7.4% |
| Whites/Caucasians | 99.8 /100 | #78 | Exceptional 7.4% |
| Czechs | 99.8 /100 | #79 | Exceptional 7.4% |
| Alaska Natives | 99.8 /100 | #80 | Exceptional 7.3% |
| Finns | 99.8 /100 | #81 | Exceptional 7.3% |
| Northern Europeans | 99.8 /100 | #82 | Exceptional 7.3% |
| Potawatomi | 99.7 /100 | #83 | Exceptional 7.3% |
| Afghans | 99.7 /100 | #84 | Exceptional 7.3% |
| Cree | 99.7 /100 | #85 | Exceptional 7.2% |
| Immigrants | Indonesia | 99.6 /100 | #86 | Exceptional 7.2% |
| Delaware | 99.6 /100 | #87 | Exceptional 7.2% |
| Immigrants | Nonimmigrants | 99.6 /100 | #88 | Exceptional 7.2% |
| British | 99.6 /100 | #89 | Exceptional 7.2% |
| Creek | 99.6 /100 | #90 | Exceptional 7.2% |
Demographics Similar to Immigrants from Czechoslovakia by 4 or more Vehicles in Household
In terms of 4 or more vehicles in household, the demographic groups most similar to Immigrants from Czechoslovakia are Ethiopian (5.8%, a difference of 0.010%), Bulgarian (5.8%, a difference of 0.050%), Immigrants from Middle Africa (5.8%, a difference of 0.19%), Mongolian (5.8%, a difference of 0.40%), and Immigrants from Poland (5.8%, a difference of 0.49%).
| Demographics | Rating | Rank | 4 or more Vehicles in Household |
| Immigrants | Eritrea | 4.5 /100 | #236 | Tragic 5.8% |
| Turks | 4.1 /100 | #237 | Tragic 5.8% |
| Immigrants | Belgium | 4.0 /100 | #238 | Tragic 5.8% |
| Immigrants | Australia | 3.8 /100 | #239 | Tragic 5.8% |
| Immigrants | Poland | 3.8 /100 | #240 | Tragic 5.8% |
| Mongolians | 3.7 /100 | #241 | Tragic 5.8% |
| Immigrants | Middle Africa | 3.4 /100 | #242 | Tragic 5.8% |
| Immigrants | Czechoslovakia | 3.2 /100 | #243 | Tragic 5.8% |
| Ethiopians | 3.2 /100 | #244 | Tragic 5.8% |
| Bulgarians | 3.1 /100 | #245 | Tragic 5.8% |
| Immigrants | North Macedonia | 2.5 /100 | #246 | Tragic 5.7% |
| Immigrants | Ethiopia | 2.4 /100 | #247 | Tragic 5.7% |
| Immigrants | Eastern Africa | 2.4 /100 | #248 | Tragic 5.7% |
| Immigrants | Southern Europe | 2.3 /100 | #249 | Tragic 5.7% |
| Immigrants | Europe | 2.3 /100 | #250 | Tragic 5.7% |