Pima vs Inupiat 1 or more Vehicles in Household
COMPARE
Pima
Inupiat
1 or more Vehicles in Household
1 or more Vehicles in Household Comparison
Pima
Inupiat
86.3%
1 OR MORE VEHICLES IN HOUSEHOLD
0.0/ 100
METRIC RATING
291st/ 347
METRIC RANK
71.5%
1 OR MORE VEHICLES IN HOUSEHOLD
0.0/ 100
METRIC RATING
338th/ 347
METRIC RANK
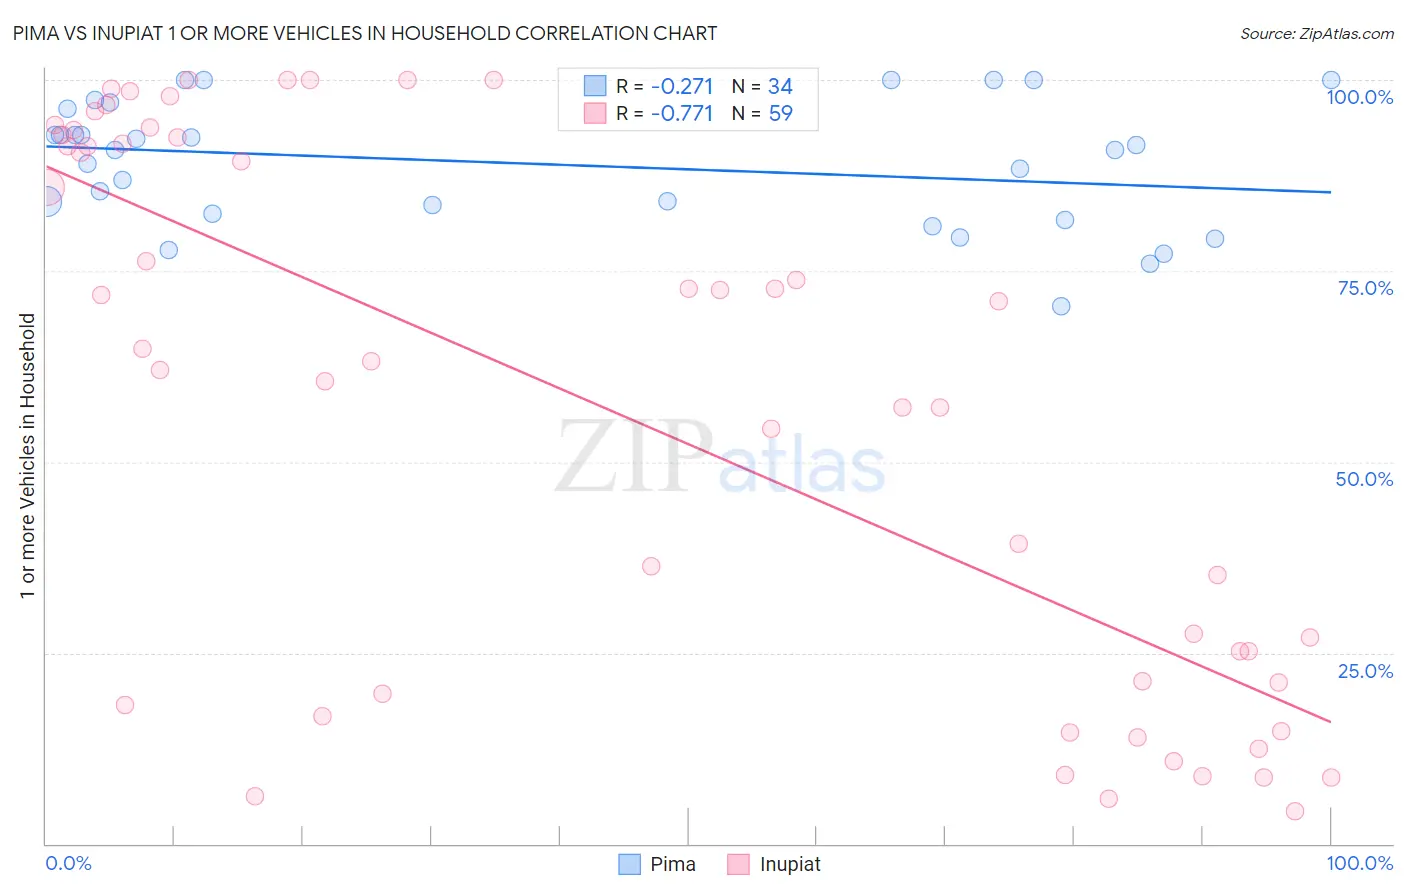
Pima vs Inupiat 1 or more Vehicles in Household Correlation Chart
The statistical analysis conducted on geographies consisting of 61,539,566 people shows a weak negative correlation between the proportion of Pima and percentage of households with 1 or more vehicles available in the United States with a correlation coefficient (R) of -0.271 and weighted average of 86.3%. Similarly, the statistical analysis conducted on geographies consisting of 96,318,712 people shows a strong negative correlation between the proportion of Inupiat and percentage of households with 1 or more vehicles available in the United States with a correlation coefficient (R) of -0.771 and weighted average of 71.5%, a difference of 20.6%.
1 or more Vehicles in Household Correlation Summary
| Measurement | Pima | Inupiat |
| Minimum | 70.4% | 4.2% |
| Maximum | 100.0% | 100.0% |
| Range | 29.6% | 95.8% |
| Mean | 89.0% | 56.9% |
| Median | 90.8% | 63.2% |
| Interquartile 25% (IQ1) | 82.5% | 19.7% |
| Interquartile 75% (IQ3) | 96.2% | 92.5% |
| Interquartile Range (IQR) | 13.6% | 72.8% |
| Standard Deviation (Sample) | 8.2% | 35.1% |
| Standard Deviation (Population) | 8.1% | 34.8% |
Similar Demographics by 1 or more Vehicles in Household
Demographics Similar to Pima by 1 or more Vehicles in Household
In terms of 1 or more vehicles in household, the demographic groups most similar to Pima are Immigrants from Australia (86.4%, a difference of 0.080%), Immigrants from Ireland (86.4%, a difference of 0.12%), Hopi (86.4%, a difference of 0.14%), Immigrants from Malaysia (86.5%, a difference of 0.21%), and Okinawan (86.1%, a difference of 0.23%).
| Demographics | Rating | Rank | 1 or more Vehicles in Household |
| Central American Indians | 0.0 /100 | #284 | Tragic 86.7% |
| Immigrants | Kazakhstan | 0.0 /100 | #285 | Tragic 86.6% |
| Immigrants | Eastern Asia | 0.0 /100 | #286 | Tragic 86.5% |
| Immigrants | Malaysia | 0.0 /100 | #287 | Tragic 86.5% |
| Hopi | 0.0 /100 | #288 | Tragic 86.4% |
| Immigrants | Ireland | 0.0 /100 | #289 | Tragic 86.4% |
| Immigrants | Australia | 0.0 /100 | #290 | Tragic 86.4% |
| Pima | 0.0 /100 | #291 | Tragic 86.3% |
| Okinawans | 0.0 /100 | #292 | Tragic 86.1% |
| Indians (Asian) | 0.0 /100 | #293 | Tragic 86.0% |
| Alaskan Athabascans | 0.0 /100 | #294 | Tragic 86.0% |
| Immigrants | Jamaica | 0.0 /100 | #295 | Tragic 85.8% |
| Immigrants | Spain | 0.0 /100 | #296 | Tragic 85.8% |
| Paraguayans | 0.0 /100 | #297 | Tragic 85.7% |
| Belizeans | 0.0 /100 | #298 | Tragic 85.7% |
Demographics Similar to Inupiat by 1 or more Vehicles in Household
In terms of 1 or more vehicles in household, the demographic groups most similar to Inupiat are Guyanese (70.8%, a difference of 1.0%), Dominican (70.7%, a difference of 1.2%), Immigrants from Barbados (70.6%, a difference of 1.3%), Immigrants from Guyana (70.6%, a difference of 1.4%), and British West Indian (70.4%, a difference of 1.7%).
| Demographics | Rating | Rank | 1 or more Vehicles in Household |
| West Indians | 0.0 /100 | #331 | Tragic 76.4% |
| Trinidadians and Tobagonians | 0.0 /100 | #332 | Tragic 76.3% |
| Immigrants | Ecuador | 0.0 /100 | #333 | Tragic 76.2% |
| Immigrants | Bangladesh | 0.0 /100 | #334 | Tragic 74.3% |
| Barbadians | 0.0 /100 | #335 | Tragic 74.0% |
| Vietnamese | 0.0 /100 | #336 | Tragic 73.8% |
| Immigrants | Uzbekistan | 0.0 /100 | #337 | Tragic 73.4% |
| Inupiat | 0.0 /100 | #338 | Tragic 71.5% |
| Guyanese | 0.0 /100 | #339 | Tragic 70.8% |
| Dominicans | 0.0 /100 | #340 | Tragic 70.7% |
| Immigrants | Barbados | 0.0 /100 | #341 | Tragic 70.6% |
| Immigrants | Guyana | 0.0 /100 | #342 | Tragic 70.6% |
| British West Indians | 0.0 /100 | #343 | Tragic 70.4% |
| Immigrants | Dominican Republic | 0.0 /100 | #344 | Tragic 68.6% |
| Immigrants | St. Vincent and the Grenadines | 0.0 /100 | #345 | Tragic 64.7% |