Iraqi vs Immigrants from Kuwait 1 or more Vehicles in Household
COMPARE
Iraqi
Immigrants from Kuwait
1 or more Vehicles in Household
1 or more Vehicles in Household Comparison
Iraqis
Immigrants from Kuwait
91.9%
1 OR MORE VEHICLES IN HOUSEHOLD
99.8/ 100
METRIC RATING
57th/ 347
METRIC RANK
90.7%
1 OR MORE VEHICLES IN HOUSEHOLD
94.7/ 100
METRIC RATING
113th/ 347
METRIC RANK
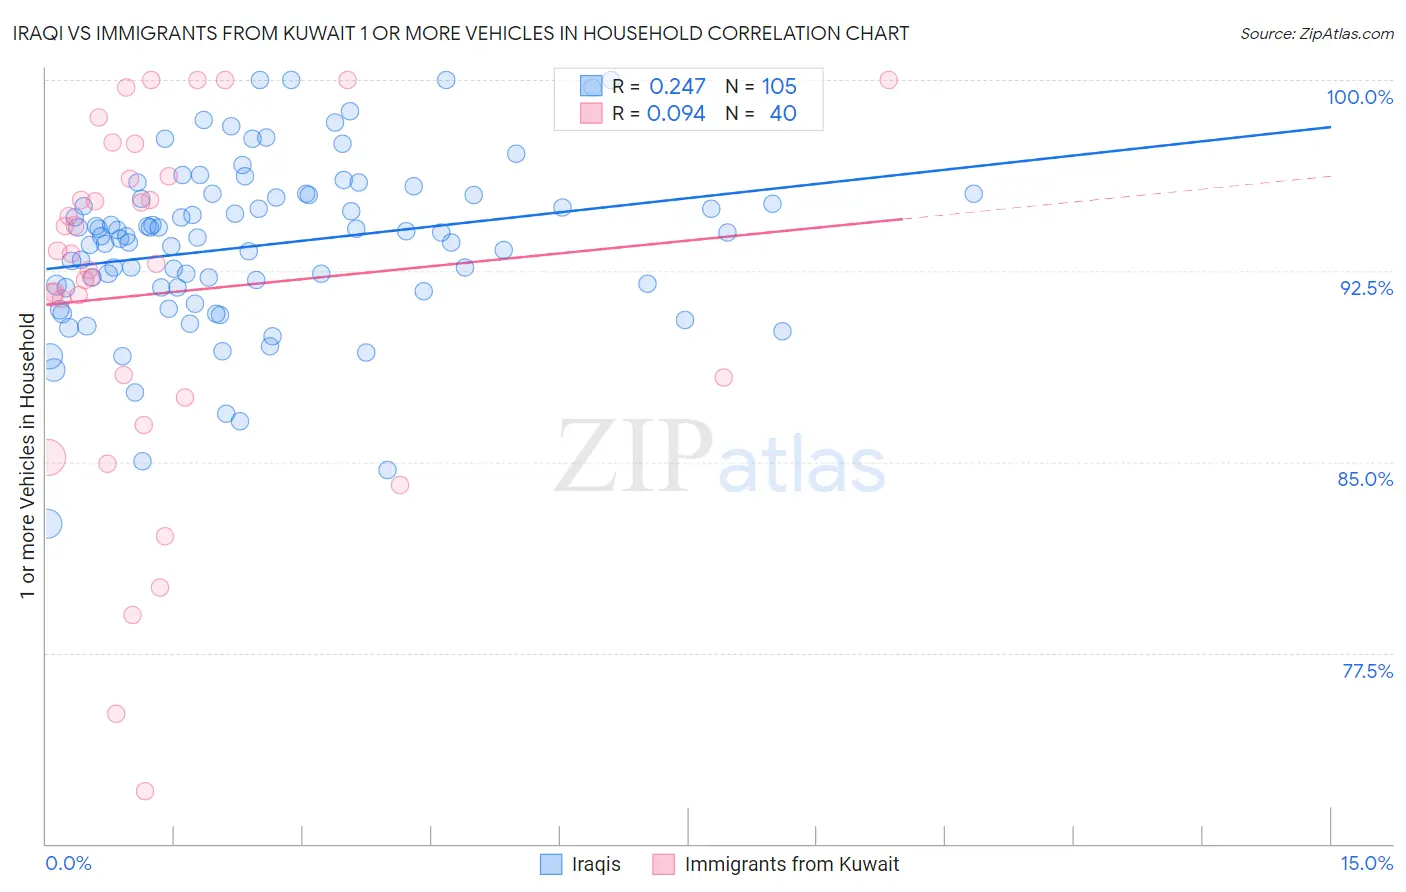
Iraqi vs Immigrants from Kuwait 1 or more Vehicles in Household Correlation Chart
The statistical analysis conducted on geographies consisting of 170,619,980 people shows a weak positive correlation between the proportion of Iraqis and percentage of households with 1 or more vehicles available in the United States with a correlation coefficient (R) of 0.247 and weighted average of 91.9%. Similarly, the statistical analysis conducted on geographies consisting of 136,852,839 people shows a slight positive correlation between the proportion of Immigrants from Kuwait and percentage of households with 1 or more vehicles available in the United States with a correlation coefficient (R) of 0.094 and weighted average of 90.7%, a difference of 1.4%.
1 or more Vehicles in Household Correlation Summary
| Measurement | Iraqi | Immigrants from Kuwait |
| Minimum | 82.6% | 72.1% |
| Maximum | 100.0% | 100.0% |
| Range | 17.4% | 27.9% |
| Mean | 93.5% | 91.6% |
| Median | 93.9% | 93.0% |
| Interquartile 25% (IQ1) | 91.8% | 87.9% |
| Interquartile 75% (IQ3) | 95.5% | 96.2% |
| Interquartile Range (IQR) | 3.6% | 8.3% |
| Standard Deviation (Sample) | 3.3% | 7.0% |
| Standard Deviation (Population) | 3.3% | 6.9% |
Similar Demographics by 1 or more Vehicles in Household
Demographics Similar to Iraqis by 1 or more Vehicles in Household
In terms of 1 or more vehicles in household, the demographic groups most similar to Iraqis are Immigrants from Mexico (91.9%, a difference of 0.020%), Venezuelan (91.9%, a difference of 0.030%), Immigrants from Afghanistan (92.0%, a difference of 0.040%), Immigrants from Venezuela (92.0%, a difference of 0.040%), and Slovak (91.9%, a difference of 0.050%).
| Demographics | Rating | Rank | 1 or more Vehicles in Household |
| Guamanians/Chamorros | 99.9 /100 | #50 | Exceptional 92.1% |
| Celtics | 99.9 /100 | #51 | Exceptional 92.1% |
| Koreans | 99.9 /100 | #52 | Exceptional 92.1% |
| Hawaiians | 99.9 /100 | #53 | Exceptional 92.0% |
| Slovenes | 99.9 /100 | #54 | Exceptional 92.0% |
| Immigrants | Afghanistan | 99.9 /100 | #55 | Exceptional 92.0% |
| Immigrants | Venezuela | 99.9 /100 | #56 | Exceptional 92.0% |
| Iraqis | 99.8 /100 | #57 | Exceptional 91.9% |
| Immigrants | Mexico | 99.8 /100 | #58 | Exceptional 91.9% |
| Venezuelans | 99.8 /100 | #59 | Exceptional 91.9% |
| Slovaks | 99.8 /100 | #60 | Exceptional 91.9% |
| Immigrants | India | 99.8 /100 | #61 | Exceptional 91.9% |
| Thais | 99.8 /100 | #62 | Exceptional 91.9% |
| Chinese | 99.8 /100 | #63 | Exceptional 91.9% |
| Croatians | 99.8 /100 | #64 | Exceptional 91.9% |
Demographics Similar to Immigrants from Kuwait by 1 or more Vehicles in Household
In terms of 1 or more vehicles in household, the demographic groups most similar to Immigrants from Kuwait are Armenian (90.7%, a difference of 0.020%), Serbian (90.7%, a difference of 0.030%), Chippewa (90.7%, a difference of 0.030%), Immigrants from Netherlands (90.8%, a difference of 0.080%), and Navajo (90.8%, a difference of 0.090%).
| Demographics | Rating | Rank | 1 or more Vehicles in Household |
| Zimbabweans | 97.7 /100 | #106 | Exceptional 91.0% |
| Maltese | 97.7 /100 | #107 | Exceptional 91.0% |
| Hispanics or Latinos | 97.6 /100 | #108 | Exceptional 91.0% |
| Delaware | 97.6 /100 | #109 | Exceptional 91.0% |
| Mexican American Indians | 97.4 /100 | #110 | Exceptional 91.0% |
| Navajo | 95.8 /100 | #111 | Exceptional 90.8% |
| Immigrants | Netherlands | 95.7 /100 | #112 | Exceptional 90.8% |
| Immigrants | Kuwait | 94.7 /100 | #113 | Exceptional 90.7% |
| Armenians | 94.5 /100 | #114 | Exceptional 90.7% |
| Serbians | 94.3 /100 | #115 | Exceptional 90.7% |
| Chippewa | 94.3 /100 | #116 | Exceptional 90.7% |
| Greeks | 93.5 /100 | #117 | Exceptional 90.6% |
| Japanese | 93.4 /100 | #118 | Exceptional 90.6% |
| Blackfeet | 92.6 /100 | #119 | Exceptional 90.6% |
| Immigrants | Thailand | 92.3 /100 | #120 | Exceptional 90.6% |