Palestinian vs Irish 2 or more Vehicles in Household
COMPARE
Palestinian
Irish
2 or more Vehicles in Household
2 or more Vehicles in Household Comparison
Palestinians
Irish
57.7%
2 OR MORE VEHICLES IN HOUSEHOLD
98.6/ 100
METRIC RATING
98th/ 347
METRIC RANK
60.1%
2 OR MORE VEHICLES IN HOUSEHOLD
100.0/ 100
METRIC RATING
37th/ 347
METRIC RANK
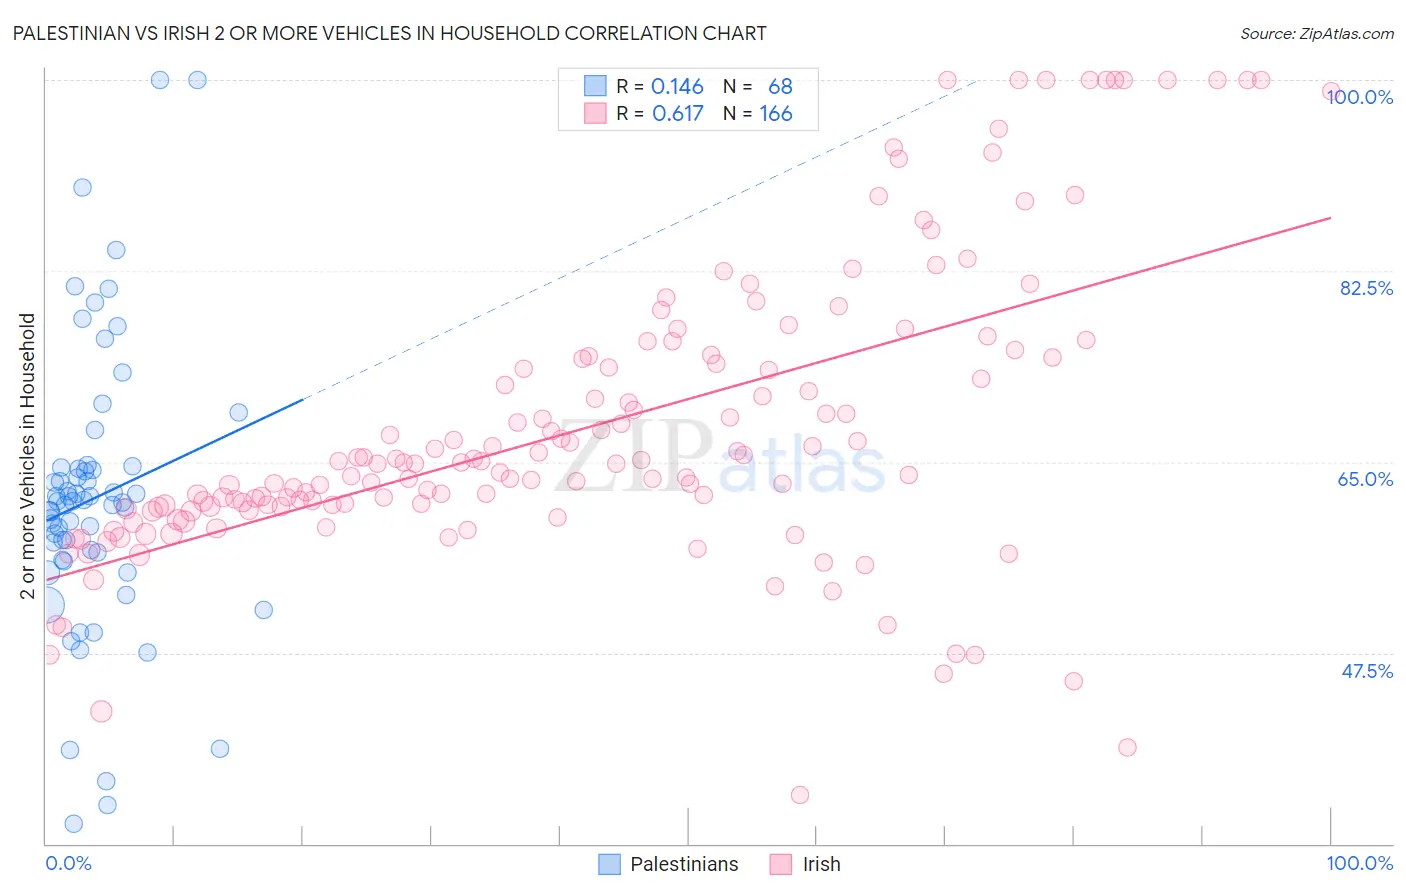
Palestinian vs Irish 2 or more Vehicles in Household Correlation Chart
The statistical analysis conducted on geographies consisting of 216,408,770 people shows a poor positive correlation between the proportion of Palestinians and percentage of households with 2 or more vehicles available in the United States with a correlation coefficient (R) of 0.146 and weighted average of 57.7%. Similarly, the statistical analysis conducted on geographies consisting of 580,068,554 people shows a significant positive correlation between the proportion of Irish and percentage of households with 2 or more vehicles available in the United States with a correlation coefficient (R) of 0.617 and weighted average of 60.1%, a difference of 4.1%.
2 or more Vehicles in Household Correlation Summary
| Measurement | Palestinian | Irish |
| Minimum | 31.8% | 34.5% |
| Maximum | 100.0% | 100.0% |
| Range | 68.2% | 65.5% |
| Mean | 61.7% | 68.2% |
| Median | 61.4% | 64.8% |
| Interquartile 25% (IQ1) | 56.3% | 60.9% |
| Interquartile 75% (IQ3) | 64.5% | 74.6% |
| Interquartile Range (IQR) | 8.1% | 13.7% |
| Standard Deviation (Sample) | 13.0% | 13.6% |
| Standard Deviation (Population) | 12.9% | 13.5% |
Similar Demographics by 2 or more Vehicles in Household
Demographics Similar to Palestinians by 2 or more Vehicles in Household
In terms of 2 or more vehicles in household, the demographic groups most similar to Palestinians are Cajun (57.7%, a difference of 0.070%), Fijian (57.6%, a difference of 0.14%), Slavic (57.8%, a difference of 0.15%), Burmese (57.8%, a difference of 0.17%), and Lebanese (57.6%, a difference of 0.19%).
| Demographics | Rating | Rank | 2 or more Vehicles in Household |
| Pakistanis | 99.0 /100 | #91 | Exceptional 57.9% |
| Shoshone | 99.0 /100 | #92 | Exceptional 57.9% |
| Ottawa | 99.0 /100 | #93 | Exceptional 57.9% |
| Filipinos | 98.9 /100 | #94 | Exceptional 57.8% |
| Hmong | 98.9 /100 | #95 | Exceptional 57.8% |
| Burmese | 98.8 /100 | #96 | Exceptional 57.8% |
| Slavs | 98.8 /100 | #97 | Exceptional 57.8% |
| Palestinians | 98.6 /100 | #98 | Exceptional 57.7% |
| Cajuns | 98.5 /100 | #99 | Exceptional 57.7% |
| Fijians | 98.4 /100 | #100 | Exceptional 57.6% |
| Lebanese | 98.3 /100 | #101 | Exceptional 57.6% |
| Immigrants | Bolivia | 98.2 /100 | #102 | Exceptional 57.6% |
| Jordanians | 98.2 /100 | #103 | Exceptional 57.6% |
| Immigrants | Indonesia | 98.2 /100 | #104 | Exceptional 57.6% |
| Immigrants | Korea | 98.2 /100 | #105 | Exceptional 57.6% |
Demographics Similar to Irish by 2 or more Vehicles in Household
In terms of 2 or more vehicles in household, the demographic groups most similar to Irish are Chinese (60.1%, a difference of 0.030%), Immigrants from Philippines (60.1%, a difference of 0.060%), American (60.0%, a difference of 0.060%), British (60.0%, a difference of 0.070%), and Spanish (60.2%, a difference of 0.18%).
| Demographics | Rating | Rank | 2 or more Vehicles in Household |
| Finns | 100.0 /100 | #30 | Exceptional 60.3% |
| Spanish American Indians | 100.0 /100 | #31 | Exceptional 60.3% |
| Arapaho | 100.0 /100 | #32 | Exceptional 60.2% |
| Immigrants | Mexico | 100.0 /100 | #33 | Exceptional 60.2% |
| Spanish | 100.0 /100 | #34 | Exceptional 60.2% |
| Immigrants | Philippines | 100.0 /100 | #35 | Exceptional 60.1% |
| Chinese | 100.0 /100 | #36 | Exceptional 60.1% |
| Irish | 100.0 /100 | #37 | Exceptional 60.1% |
| Americans | 100.0 /100 | #38 | Exceptional 60.0% |
| British | 100.0 /100 | #39 | Exceptional 60.0% |
| Cherokee | 100.0 /100 | #40 | Exceptional 59.9% |
| Northern Europeans | 100.0 /100 | #41 | Exceptional 59.9% |
| Malaysians | 100.0 /100 | #42 | Exceptional 59.8% |
| Czechoslovakians | 100.0 /100 | #43 | Exceptional 59.8% |
| French | 100.0 /100 | #44 | Exceptional 59.8% |