Central American Indian vs Immigrants from Greece No Vehicles in Household
COMPARE
Central American Indian
Immigrants from Greece
No Vehicles in Household
No Vehicles in Household Comparison
Central American Indians
Immigrants from Greece
13.3%
NO VEHICLES IN HOUSEHOLD
0.0/ 100
METRIC RATING
281st/ 347
METRIC RANK
14.7%
NO VEHICLES IN HOUSEHOLD
0.0/ 100
METRIC RATING
299th/ 347
METRIC RANK
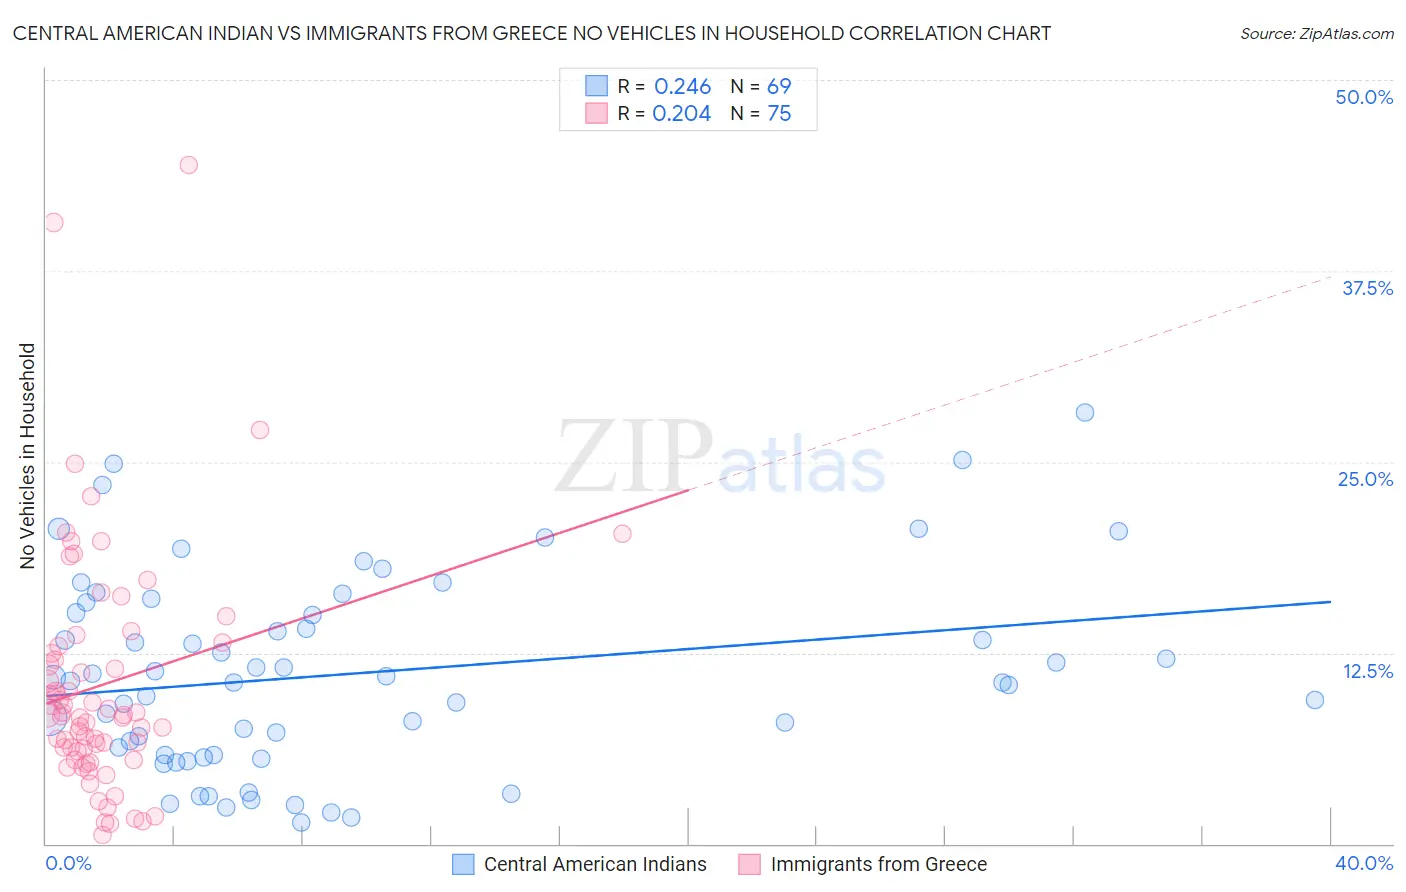
Central American Indian vs Immigrants from Greece No Vehicles in Household Correlation Chart
The statistical analysis conducted on geographies consisting of 325,699,526 people shows a weak positive correlation between the proportion of Central American Indians and percentage of households with no vehicle available in the United States with a correlation coefficient (R) of 0.246 and weighted average of 13.3%. Similarly, the statistical analysis conducted on geographies consisting of 216,580,557 people shows a weak positive correlation between the proportion of Immigrants from Greece and percentage of households with no vehicle available in the United States with a correlation coefficient (R) of 0.204 and weighted average of 14.7%, a difference of 10.1%.
No Vehicles in Household Correlation Summary
| Measurement | Central American Indian | Immigrants from Greece |
| Minimum | 1.4% | 0.60% |
| Maximum | 28.3% | 44.5% |
| Range | 26.9% | 43.9% |
| Mean | 11.1% | 10.4% |
| Median | 10.7% | 8.4% |
| Interquartile 25% (IQ1) | 5.8% | 6.1% |
| Interquartile 75% (IQ3) | 15.5% | 13.0% |
| Interquartile Range (IQR) | 9.6% | 6.9% |
| Standard Deviation (Sample) | 6.4% | 7.9% |
| Standard Deviation (Population) | 6.3% | 7.8% |
Demographics Similar to Central American Indians and Immigrants from Greece by No Vehicles in Household
In terms of no vehicles in household, the demographic groups most similar to Central American Indians are Alsatian (13.2%, a difference of 1.4%), Immigrants from Eastern Asia (13.5%, a difference of 1.5%), Immigrants from Kazakhstan (13.6%, a difference of 1.5%), Immigrants from Malaysia (13.6%, a difference of 1.8%), and Immigrants from Eastern Europe (13.6%, a difference of 1.8%). Similarly, the demographic groups most similar to Immigrants from Greece are Moroccan (14.7%, a difference of 0.20%), Immigrants from Panama (14.6%, a difference of 0.35%), Immigrants from Spain (14.5%, a difference of 1.0%), Yuman (14.9%, a difference of 1.1%), and Paraguayan (14.4%, a difference of 2.4%).
| Demographics | Rating | Rank | No Vehicles in Household |
| Alsatians | 0.0 /100 | #280 | Tragic 13.2% |
| Central American Indians | 0.0 /100 | #281 | Tragic 13.3% |
| Immigrants | Eastern Asia | 0.0 /100 | #282 | Tragic 13.5% |
| Immigrants | Kazakhstan | 0.0 /100 | #283 | Tragic 13.6% |
| Immigrants | Malaysia | 0.0 /100 | #284 | Tragic 13.6% |
| Immigrants | Eastern Europe | 0.0 /100 | #285 | Tragic 13.6% |
| Colville | 0.0 /100 | #286 | Tragic 13.7% |
| Immigrants | Ireland | 0.0 /100 | #287 | Tragic 13.7% |
| Hopi | 0.0 /100 | #288 | Tragic 13.7% |
| Immigrants | Australia | 0.0 /100 | #289 | Tragic 13.8% |
| Indians (Asian) | 0.0 /100 | #290 | Tragic 14.1% |
| Okinawans | 0.0 /100 | #291 | Tragic 14.1% |
| Pima | 0.0 /100 | #292 | Tragic 14.1% |
| Immigrants | Jamaica | 0.0 /100 | #293 | Tragic 14.2% |
| Belizeans | 0.0 /100 | #294 | Tragic 14.3% |
| Paraguayans | 0.0 /100 | #295 | Tragic 14.4% |
| Immigrants | Spain | 0.0 /100 | #296 | Tragic 14.5% |
| Immigrants | Panama | 0.0 /100 | #297 | Tragic 14.6% |
| Moroccans | 0.0 /100 | #298 | Tragic 14.7% |
| Immigrants | Greece | 0.0 /100 | #299 | Tragic 14.7% |
| Yuman | 0.0 /100 | #300 | Tragic 14.9% |