Samoan vs Immigrants from Greece No Vehicles in Household
COMPARE
Samoan
Immigrants from Greece
No Vehicles in Household
No Vehicles in Household Comparison
Samoans
Immigrants from Greece
7.6%
NO VEHICLES IN HOUSEHOLD
100.0/ 100
METRIC RATING
28th/ 347
METRIC RANK
14.7%
NO VEHICLES IN HOUSEHOLD
0.0/ 100
METRIC RATING
299th/ 347
METRIC RANK
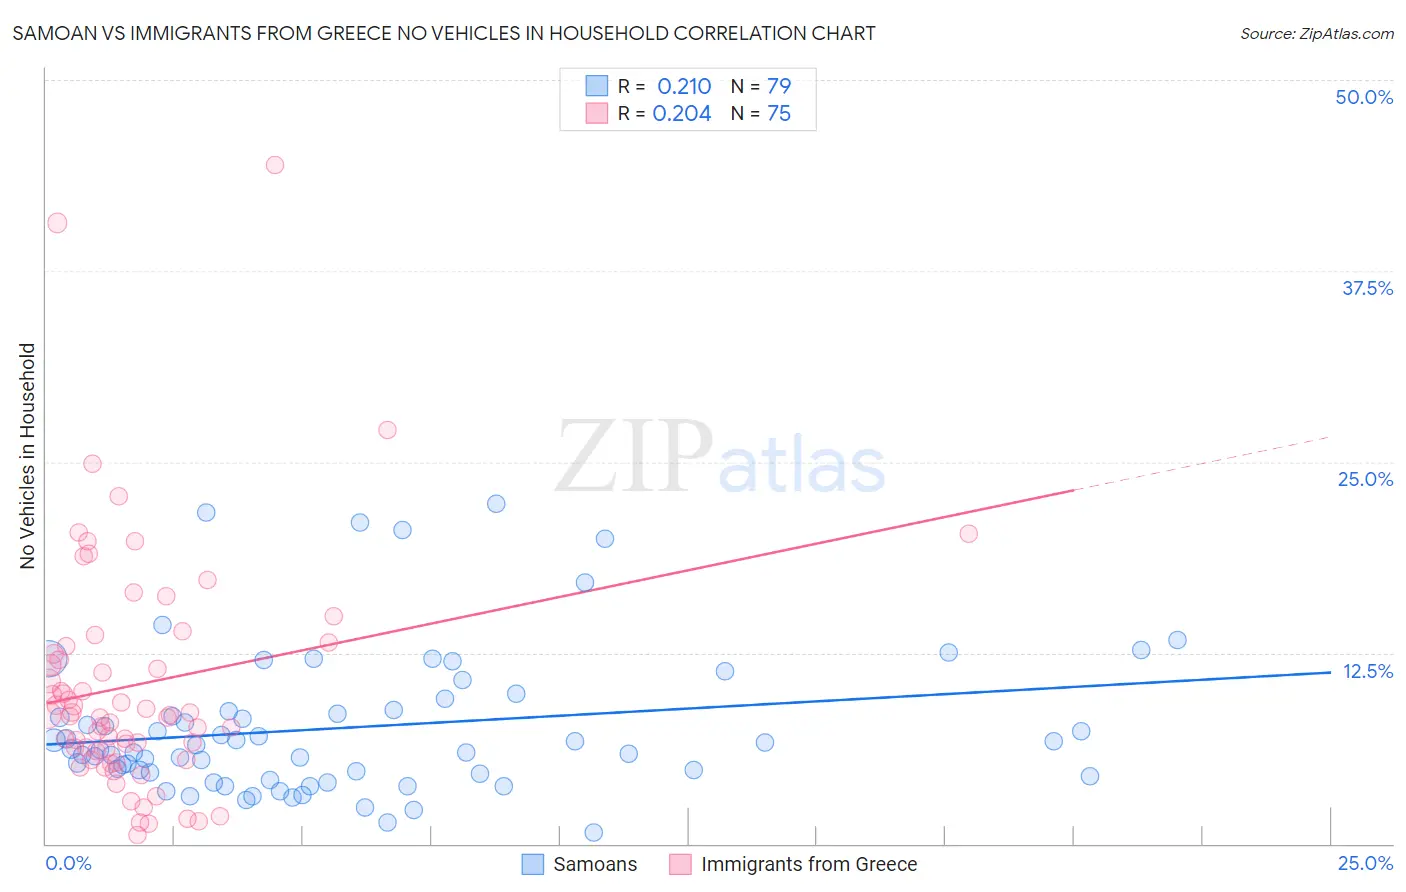
Samoan vs Immigrants from Greece No Vehicles in Household Correlation Chart
The statistical analysis conducted on geographies consisting of 224,864,894 people shows a weak positive correlation between the proportion of Samoans and percentage of households with no vehicle available in the United States with a correlation coefficient (R) of 0.210 and weighted average of 7.6%. Similarly, the statistical analysis conducted on geographies consisting of 216,580,557 people shows a weak positive correlation between the proportion of Immigrants from Greece and percentage of households with no vehicle available in the United States with a correlation coefficient (R) of 0.204 and weighted average of 14.7%, a difference of 92.5%.
No Vehicles in Household Correlation Summary
| Measurement | Samoan | Immigrants from Greece |
| Minimum | 0.73% | 0.60% |
| Maximum | 22.3% | 44.5% |
| Range | 21.5% | 43.9% |
| Mean | 7.6% | 10.4% |
| Median | 6.2% | 8.4% |
| Interquartile 25% (IQ1) | 4.6% | 6.1% |
| Interquartile 75% (IQ3) | 8.8% | 13.0% |
| Interquartile Range (IQR) | 4.2% | 6.9% |
| Standard Deviation (Sample) | 4.8% | 7.9% |
| Standard Deviation (Population) | 4.7% | 7.8% |
Similar Demographics by No Vehicles in Household
Demographics Similar to Samoans by No Vehicles in Household
In terms of no vehicles in household, the demographic groups most similar to Samoans are American (7.7%, a difference of 0.29%), British (7.6%, a difference of 0.55%), Finnish (7.7%, a difference of 0.59%), Sri Lankan (7.6%, a difference of 0.60%), and Native Hawaiian (7.7%, a difference of 0.74%).
| Demographics | Rating | Rank | No Vehicles in Household |
| Nepalese | 100.0 /100 | #21 | Exceptional 7.4% |
| Irish | 100.0 /100 | #22 | Exceptional 7.4% |
| French | 100.0 /100 | #23 | Exceptional 7.4% |
| Immigrants | Iraq | 100.0 /100 | #24 | Exceptional 7.5% |
| Yaqui | 100.0 /100 | #25 | Exceptional 7.5% |
| Sri Lankans | 100.0 /100 | #26 | Exceptional 7.6% |
| British | 100.0 /100 | #27 | Exceptional 7.6% |
| Samoans | 100.0 /100 | #28 | Exceptional 7.6% |
| Americans | 100.0 /100 | #29 | Exceptional 7.7% |
| Finns | 100.0 /100 | #30 | Exceptional 7.7% |
| Native Hawaiians | 100.0 /100 | #31 | Exceptional 7.7% |
| Malaysians | 100.0 /100 | #32 | Exceptional 7.7% |
| Immigrants | Taiwan | 100.0 /100 | #33 | Exceptional 7.7% |
| Immigrants | Vietnam | 100.0 /100 | #34 | Exceptional 7.7% |
| Cherokee | 99.9 /100 | #35 | Exceptional 7.7% |
Demographics Similar to Immigrants from Greece by No Vehicles in Household
In terms of no vehicles in household, the demographic groups most similar to Immigrants from Greece are Moroccan (14.7%, a difference of 0.20%), Immigrants from Panama (14.6%, a difference of 0.35%), Immigrants from Spain (14.5%, a difference of 1.0%), Yuman (14.9%, a difference of 1.1%), and Immigrants from Ukraine (14.9%, a difference of 1.1%).
| Demographics | Rating | Rank | No Vehicles in Household |
| Pima | 0.0 /100 | #292 | Tragic 14.1% |
| Immigrants | Jamaica | 0.0 /100 | #293 | Tragic 14.2% |
| Belizeans | 0.0 /100 | #294 | Tragic 14.3% |
| Paraguayans | 0.0 /100 | #295 | Tragic 14.4% |
| Immigrants | Spain | 0.0 /100 | #296 | Tragic 14.5% |
| Immigrants | Panama | 0.0 /100 | #297 | Tragic 14.6% |
| Moroccans | 0.0 /100 | #298 | Tragic 14.7% |
| Immigrants | Greece | 0.0 /100 | #299 | Tragic 14.7% |
| Yuman | 0.0 /100 | #300 | Tragic 14.9% |
| Immigrants | Ukraine | 0.0 /100 | #301 | Tragic 14.9% |
| Haitians | 0.0 /100 | #302 | Tragic 14.9% |
| Immigrants | Western Africa | 0.0 /100 | #303 | Tragic 15.0% |
| Immigrants | Russia | 0.0 /100 | #304 | Tragic 15.1% |
| Immigrants | China | 0.0 /100 | #305 | Tragic 15.2% |
| Immigrants | Belize | 0.0 /100 | #306 | Tragic 15.4% |