Immigrants from Serbia vs Houma No Vehicles in Household
COMPARE
Immigrants from Serbia
Houma
No Vehicles in Household
No Vehicles in Household Comparison
Immigrants from Serbia
Houma
11.9%
NO VEHICLES IN HOUSEHOLD
1.5/ 100
METRIC RATING
252nd/ 347
METRIC RANK
11.5%
NO VEHICLES IN HOUSEHOLD
4.7/ 100
METRIC RATING
233rd/ 347
METRIC RANK
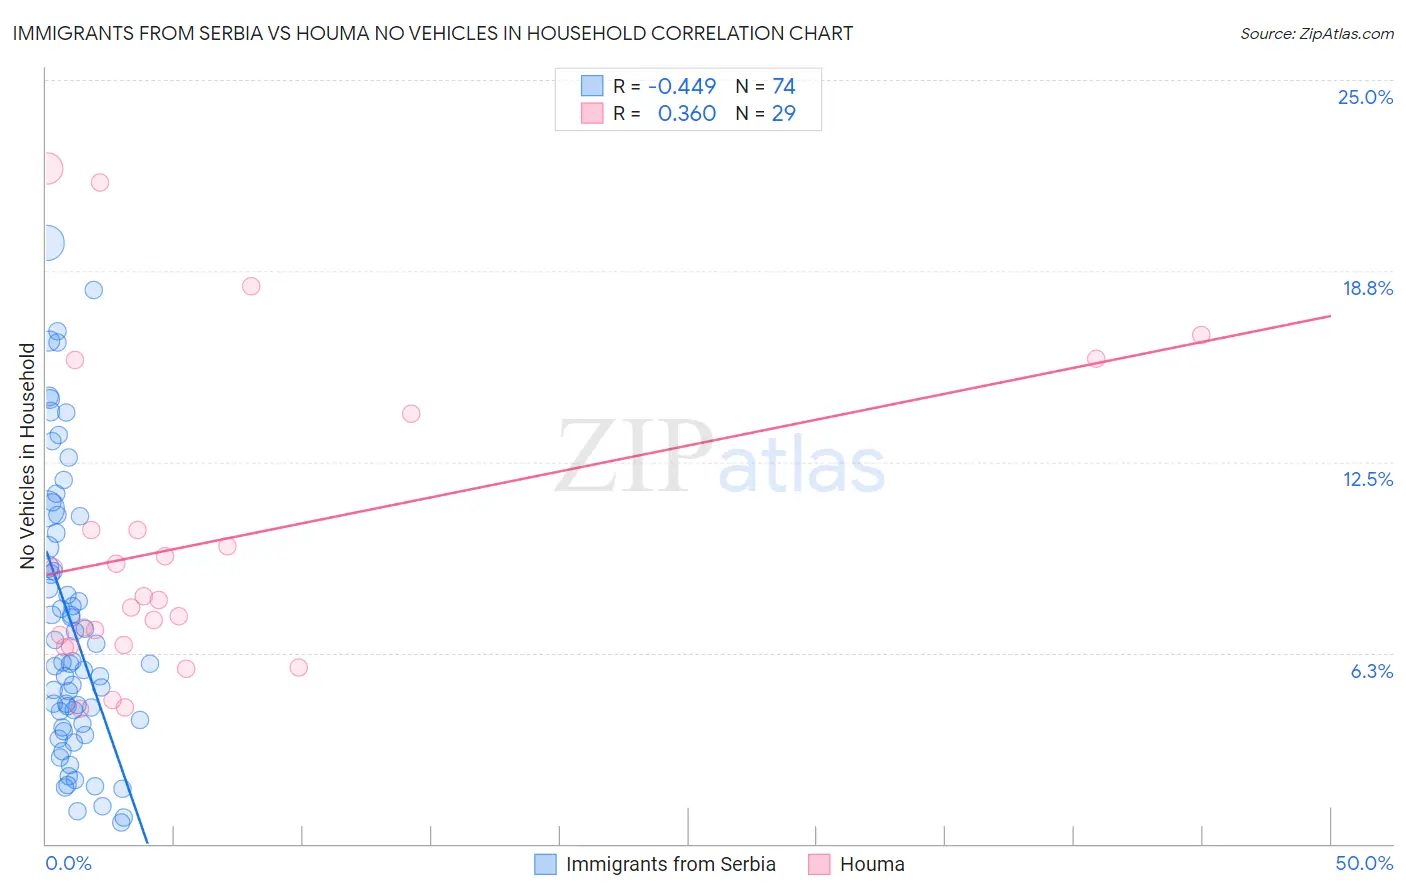
Immigrants from Serbia vs Houma No Vehicles in Household Correlation Chart
The statistical analysis conducted on geographies consisting of 131,395,325 people shows a moderate negative correlation between the proportion of Immigrants from Serbia and percentage of households with no vehicle available in the United States with a correlation coefficient (R) of -0.449 and weighted average of 11.9%. Similarly, the statistical analysis conducted on geographies consisting of 36,780,476 people shows a mild positive correlation between the proportion of Houma and percentage of households with no vehicle available in the United States with a correlation coefficient (R) of 0.360 and weighted average of 11.5%, a difference of 3.7%.
No Vehicles in Household Correlation Summary
| Measurement | Immigrants from Serbia | Houma |
| Minimum | 0.71% | 4.4% |
| Maximum | 19.7% | 22.1% |
| Range | 19.0% | 17.7% |
| Mean | 7.2% | 9.9% |
| Median | 5.9% | 8.0% |
| Interquartile 25% (IQ1) | 3.9% | 6.5% |
| Interquartile 75% (IQ3) | 10.2% | 12.2% |
| Interquartile Range (IQR) | 6.2% | 5.7% |
| Standard Deviation (Sample) | 4.6% | 5.0% |
| Standard Deviation (Population) | 4.5% | 4.9% |
Demographics Similar to Immigrants from Serbia and Houma by No Vehicles in Household
In terms of no vehicles in household, the demographic groups most similar to Immigrants from Serbia are Black/African American (11.9%, a difference of 0.25%), Paiute (11.8%, a difference of 0.60%), Immigrants from Nigeria (11.8%, a difference of 0.83%), Immigrants from Belgium (11.8%, a difference of 0.86%), and Immigrants from Czechoslovakia (11.8%, a difference of 0.87%). Similarly, the demographic groups most similar to Houma are Immigrants from Turkey (11.5%, a difference of 0.040%), Immigrants from Peru (11.5%, a difference of 0.19%), Kiowa (11.5%, a difference of 0.57%), Cree (11.6%, a difference of 0.92%), and Ute (11.6%, a difference of 1.2%).
| Demographics | Rating | Rank | No Vehicles in Household |
| Immigrants | Turkey | 4.8 /100 | #232 | Tragic 11.5% |
| Houma | 4.7 /100 | #233 | Tragic 11.5% |
| Immigrants | Peru | 4.5 /100 | #234 | Tragic 11.5% |
| Kiowa | 4.0 /100 | #235 | Tragic 11.5% |
| Cree | 3.5 /100 | #236 | Tragic 11.6% |
| Ute | 3.3 /100 | #237 | Tragic 11.6% |
| Russians | 3.2 /100 | #238 | Tragic 11.6% |
| Taiwanese | 2.8 /100 | #239 | Tragic 11.7% |
| Immigrants | Immigrants | 2.7 /100 | #240 | Tragic 11.7% |
| Eastern Europeans | 2.7 /100 | #241 | Tragic 11.7% |
| Turks | 2.6 /100 | #242 | Tragic 11.7% |
| Cheyenne | 2.4 /100 | #243 | Tragic 11.7% |
| Immigrants | Portugal | 2.2 /100 | #244 | Tragic 11.7% |
| Immigrants | Honduras | 2.1 /100 | #245 | Tragic 11.8% |
| Menominee | 2.0 /100 | #246 | Tragic 11.8% |
| Immigrants | Czechoslovakia | 2.0 /100 | #247 | Tragic 11.8% |
| Immigrants | Belgium | 1.9 /100 | #248 | Tragic 11.8% |
| Immigrants | Nigeria | 1.9 /100 | #249 | Tragic 11.8% |
| Paiute | 1.8 /100 | #250 | Tragic 11.8% |
| Blacks/African Americans | 1.6 /100 | #251 | Tragic 11.9% |
| Immigrants | Serbia | 1.5 /100 | #252 | Tragic 11.9% |