Immigrants from Netherlands vs Nicaraguan 4 or more Vehicles in Household
COMPARE
Immigrants from Netherlands
Nicaraguan
4 or more Vehicles in Household
4 or more Vehicles in Household Comparison
Immigrants from Netherlands
Nicaraguans
6.6%
4 OR MORE VEHICLES IN HOUSEHOLD
87.8/ 100
METRIC RATING
132nd/ 347
METRIC RANK
7.0%
4 OR MORE VEHICLES IN HOUSEHOLD
98.0/ 100
METRIC RATING
107th/ 347
METRIC RANK
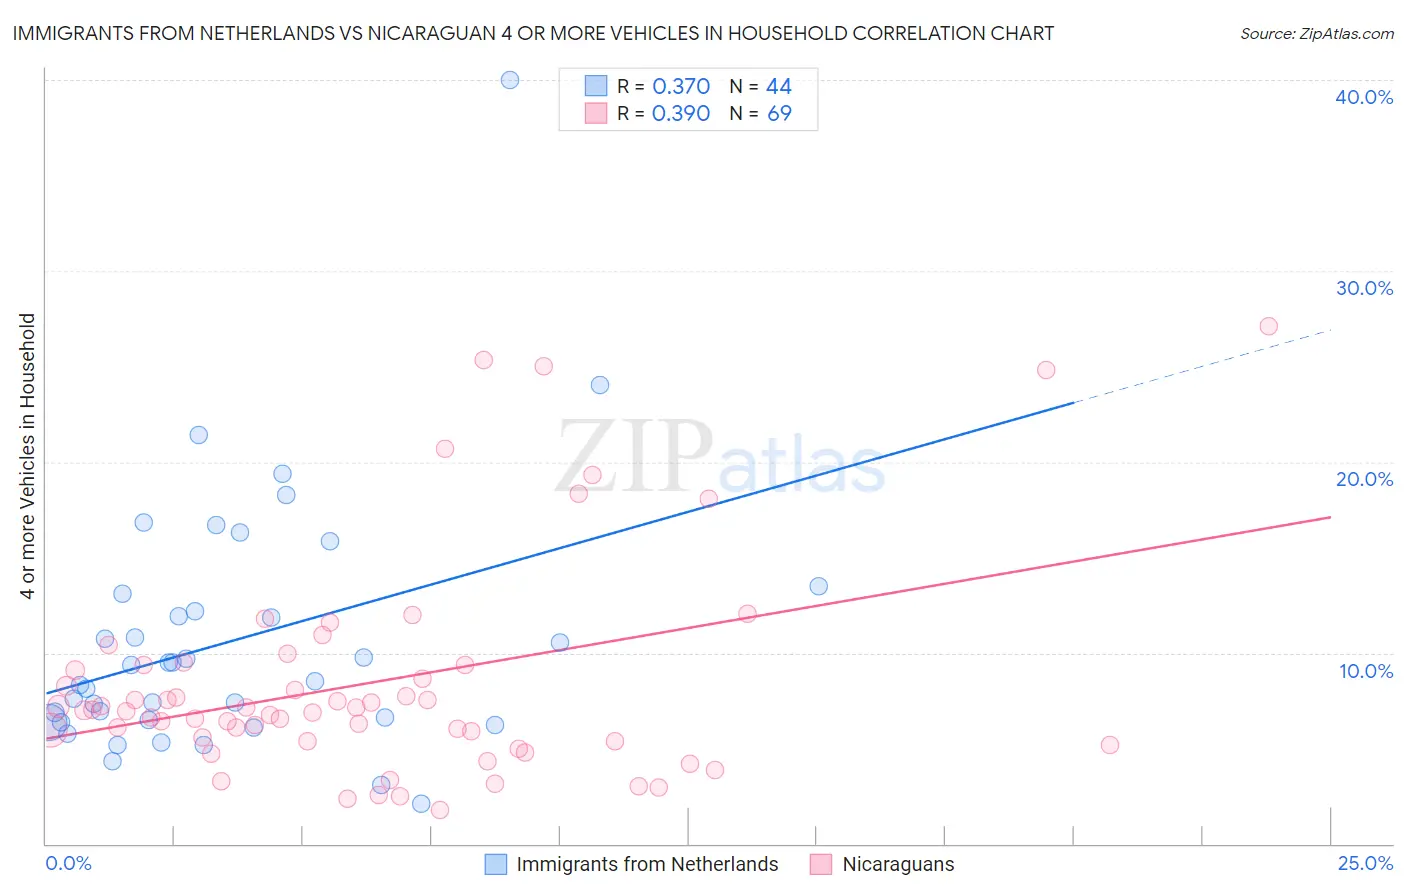
Immigrants from Netherlands vs Nicaraguan 4 or more Vehicles in Household Correlation Chart
The statistical analysis conducted on geographies consisting of 237,226,549 people shows a mild positive correlation between the proportion of Immigrants from Netherlands and percentage of households with 4 or more vehicles available in the United States with a correlation coefficient (R) of 0.370 and weighted average of 6.6%. Similarly, the statistical analysis conducted on geographies consisting of 284,526,626 people shows a mild positive correlation between the proportion of Nicaraguans and percentage of households with 4 or more vehicles available in the United States with a correlation coefficient (R) of 0.390 and weighted average of 7.0%, a difference of 4.7%.
4 or more Vehicles in Household Correlation Summary
| Measurement | Immigrants from Netherlands | Nicaraguan |
| Minimum | 2.1% | 1.8% |
| Maximum | 40.0% | 27.1% |
| Range | 37.9% | 25.3% |
| Mean | 10.6% | 8.5% |
| Median | 8.9% | 7.0% |
| Interquartile 25% (IQ1) | 6.4% | 5.3% |
| Interquartile 75% (IQ3) | 12.6% | 9.4% |
| Interquartile Range (IQR) | 6.2% | 4.0% |
| Standard Deviation (Sample) | 6.7% | 5.7% |
| Standard Deviation (Population) | 6.6% | 5.7% |
Similar Demographics by 4 or more Vehicles in Household
Demographics Similar to Immigrants from Netherlands by 4 or more Vehicles in Household
In terms of 4 or more vehicles in household, the demographic groups most similar to Immigrants from Netherlands are Maltese (6.7%, a difference of 0.14%), Armenian (6.6%, a difference of 0.19%), Ottawa (6.6%, a difference of 0.21%), Tohono O'odham (6.6%, a difference of 0.24%), and Immigrants from Scotland (6.7%, a difference of 0.29%).
| Demographics | Rating | Rank | 4 or more Vehicles in Household |
| Austrians | 94.1 /100 | #125 | Exceptional 6.8% |
| Belgians | 94.1 /100 | #126 | Exceptional 6.8% |
| Immigrants | Korea | 93.8 /100 | #127 | Exceptional 6.8% |
| Immigrants | Bolivia | 92.5 /100 | #128 | Exceptional 6.7% |
| Immigrants | England | 92.0 /100 | #129 | Exceptional 6.7% |
| Immigrants | Scotland | 89.0 /100 | #130 | Excellent 6.7% |
| Maltese | 88.4 /100 | #131 | Excellent 6.7% |
| Immigrants | Netherlands | 87.8 /100 | #132 | Excellent 6.6% |
| Armenians | 86.9 /100 | #133 | Excellent 6.6% |
| Ottawa | 86.9 /100 | #134 | Excellent 6.6% |
| Tohono O'odham | 86.7 /100 | #135 | Excellent 6.6% |
| Luxembourgers | 86.4 /100 | #136 | Excellent 6.6% |
| French Canadians | 85.4 /100 | #137 | Excellent 6.6% |
| Italians | 84.5 /100 | #138 | Excellent 6.6% |
| Jordanians | 82.1 /100 | #139 | Excellent 6.6% |
Demographics Similar to Nicaraguans by 4 or more Vehicles in Household
In terms of 4 or more vehicles in household, the demographic groups most similar to Nicaraguans are Guatemalan (7.0%, a difference of 0.010%), French (6.9%, a difference of 0.34%), Hmong (7.0%, a difference of 0.36%), German Russian (7.0%, a difference of 0.36%), and Filipino (6.9%, a difference of 0.52%).
| Demographics | Rating | Rank | 4 or more Vehicles in Household |
| Taiwanese | 98.7 /100 | #100 | Exceptional 7.0% |
| Pakistanis | 98.7 /100 | #101 | Exceptional 7.0% |
| Asians | 98.6 /100 | #102 | Exceptional 7.0% |
| Blackfeet | 98.6 /100 | #103 | Exceptional 7.0% |
| Hmong | 98.3 /100 | #104 | Exceptional 7.0% |
| German Russians | 98.3 /100 | #105 | Exceptional 7.0% |
| Guatemalans | 98.1 /100 | #106 | Exceptional 7.0% |
| Nicaraguans | 98.0 /100 | #107 | Exceptional 7.0% |
| French | 97.7 /100 | #108 | Exceptional 6.9% |
| Filipinos | 97.6 /100 | #109 | Exceptional 6.9% |
| Immigrants | Thailand | 97.0 /100 | #110 | Exceptional 6.9% |
| Aleuts | 97.0 /100 | #111 | Exceptional 6.9% |
| Hopi | 97.0 /100 | #112 | Exceptional 6.9% |
| Canadians | 96.4 /100 | #113 | Exceptional 6.9% |
| Bolivians | 96.3 /100 | #114 | Exceptional 6.8% |