Nonimmigrants vs Immigrants from Switzerland 2 or more Vehicles in Household
COMPARE
Nonimmigrants
Immigrants from Switzerland
2 or more Vehicles in Household
2 or more Vehicles in Household Comparison
Nonimmigrants
Immigrants from Switzerland
58.8%
2 OR MORE VEHICLES IN HOUSEHOLD
99.8/ 100
METRIC RATING
62nd/ 347
METRIC RANK
53.4%
2 OR MORE VEHICLES IN HOUSEHOLD
3.0/ 100
METRIC RATING
234th/ 347
METRIC RANK
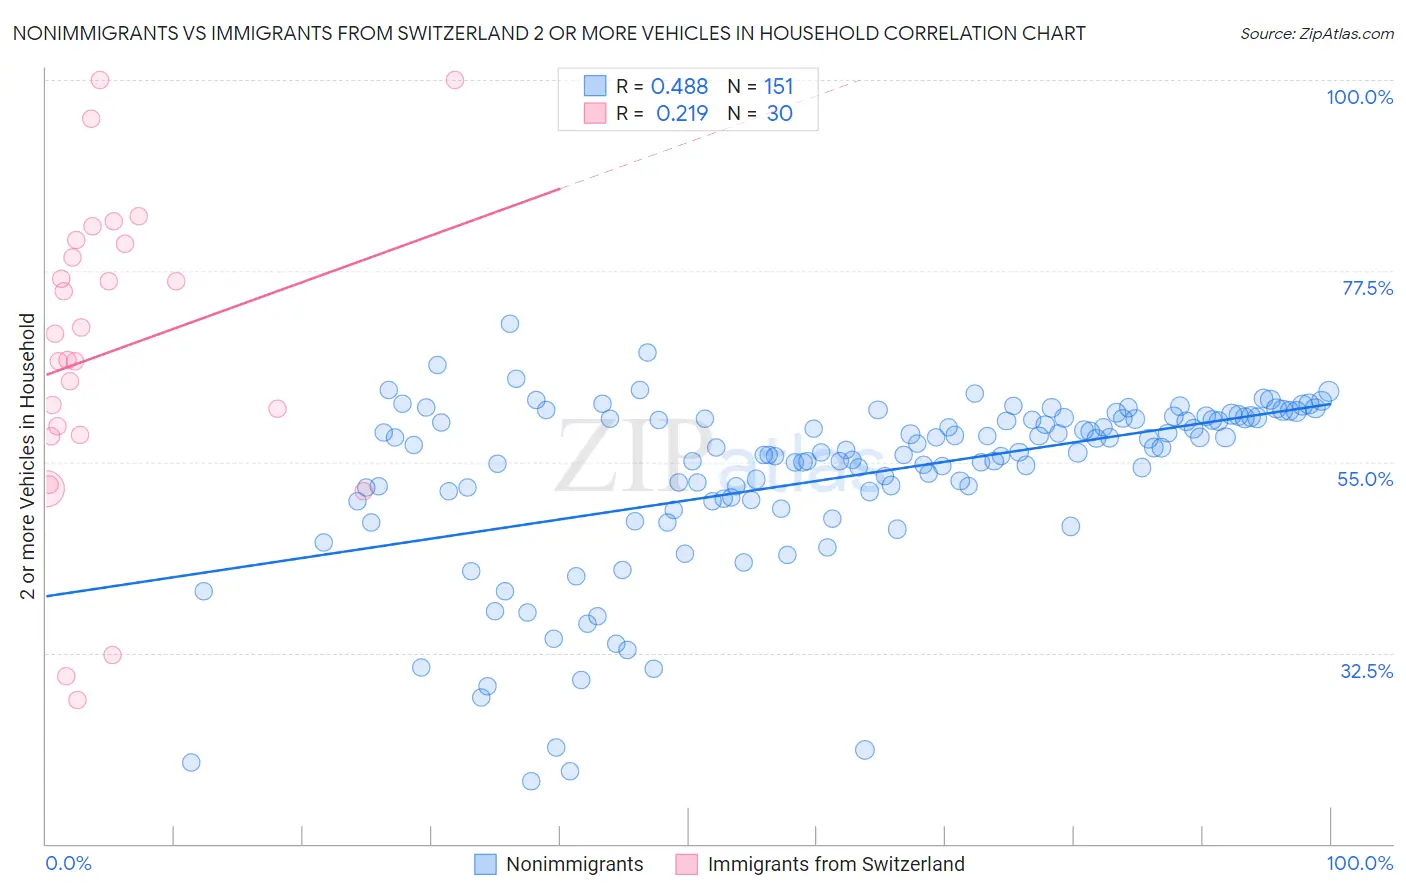
Nonimmigrants vs Immigrants from Switzerland 2 or more Vehicles in Household Correlation Chart
The statistical analysis conducted on geographies consisting of 584,662,841 people shows a moderate positive correlation between the proportion of Nonimmigrants and percentage of households with 2 or more vehicles available in the United States with a correlation coefficient (R) of 0.488 and weighted average of 58.8%. Similarly, the statistical analysis conducted on geographies consisting of 148,072,536 people shows a weak positive correlation between the proportion of Immigrants from Switzerland and percentage of households with 2 or more vehicles available in the United States with a correlation coefficient (R) of 0.219 and weighted average of 53.4%, a difference of 10.0%.
2 or more Vehicles in Household Correlation Summary
| Measurement | Nonimmigrants | Immigrants from Switzerland |
| Minimum | 17.3% | 27.0% |
| Maximum | 71.2% | 100.0% |
| Range | 53.9% | 73.0% |
| Mean | 53.2% | 68.0% |
| Median | 56.1% | 68.6% |
| Interquartile 25% (IQ1) | 50.6% | 58.2% |
| Interquartile 75% (IQ3) | 60.1% | 80.7% |
| Interquartile Range (IQR) | 9.6% | 22.5% |
| Standard Deviation (Sample) | 10.5% | 18.4% |
| Standard Deviation (Population) | 10.5% | 18.1% |
Similar Demographics by 2 or more Vehicles in Household
Demographics Similar to Nonimmigrants by 2 or more Vehicles in Household
In terms of 2 or more vehicles in household, the demographic groups most similar to Nonimmigrants are Osage (58.8%, a difference of 0.040%), Mexican American Indian (58.7%, a difference of 0.070%), French Canadian (58.9%, a difference of 0.17%), Spanish American (58.9%, a difference of 0.19%), and Immigrants from Scotland (58.9%, a difference of 0.22%).
| Demographics | Rating | Rank | 2 or more Vehicles in Household |
| Luxembourgers | 99.9 /100 | #55 | Exceptional 59.1% |
| Chickasaw | 99.9 /100 | #56 | Exceptional 59.0% |
| Afghans | 99.9 /100 | #57 | Exceptional 59.0% |
| Immigrants | Scotland | 99.8 /100 | #58 | Exceptional 58.9% |
| Spanish Americans | 99.8 /100 | #59 | Exceptional 58.9% |
| French Canadians | 99.8 /100 | #60 | Exceptional 58.9% |
| Osage | 99.8 /100 | #61 | Exceptional 58.8% |
| Immigrants | Nonimmigrants | 99.8 /100 | #62 | Exceptional 58.8% |
| Mexican American Indians | 99.8 /100 | #63 | Exceptional 58.7% |
| Portuguese | 99.7 /100 | #64 | Exceptional 58.6% |
| Immigrants | Central America | 99.7 /100 | #65 | Exceptional 58.6% |
| Croatians | 99.7 /100 | #66 | Exceptional 58.6% |
| Laotians | 99.7 /100 | #67 | Exceptional 58.6% |
| Canadians | 99.7 /100 | #68 | Exceptional 58.6% |
| Pennsylvania Germans | 99.7 /100 | #69 | Exceptional 58.5% |
Demographics Similar to Immigrants from Switzerland by 2 or more Vehicles in Household
In terms of 2 or more vehicles in household, the demographic groups most similar to Immigrants from Switzerland are Immigrants from Middle Africa (53.4%, a difference of 0.030%), Immigrants from Guatemala (53.5%, a difference of 0.060%), Ugandan (53.5%, a difference of 0.060%), Panamanian (53.5%, a difference of 0.13%), and Indonesian (53.4%, a difference of 0.13%).
| Demographics | Rating | Rank | 2 or more Vehicles in Household |
| Sudanese | 4.1 /100 | #227 | Tragic 53.6% |
| Alaska Natives | 3.9 /100 | #228 | Tragic 53.6% |
| Immigrants | Turkey | 3.8 /100 | #229 | Tragic 53.6% |
| Immigrants | Nepal | 3.6 /100 | #230 | Tragic 53.5% |
| Panamanians | 3.4 /100 | #231 | Tragic 53.5% |
| Immigrants | Guatemala | 3.2 /100 | #232 | Tragic 53.5% |
| Ugandans | 3.2 /100 | #233 | Tragic 53.5% |
| Immigrants | Switzerland | 3.0 /100 | #234 | Tragic 53.4% |
| Immigrants | Middle Africa | 3.0 /100 | #235 | Tragic 53.4% |
| Indonesians | 2.7 /100 | #236 | Tragic 53.4% |
| Macedonians | 2.4 /100 | #237 | Tragic 53.3% |
| Immigrants | Armenia | 2.3 /100 | #238 | Tragic 53.3% |
| Cambodians | 2.3 /100 | #239 | Tragic 53.3% |
| Immigrants | Europe | 2.1 /100 | #240 | Tragic 53.2% |
| Immigrants | Sierra Leone | 2.1 /100 | #241 | Tragic 53.2% |