Immigrants from Cuba vs Cambodian 4 or more Vehicles in Household
COMPARE
Immigrants from Cuba
Cambodian
4 or more Vehicles in Household
4 or more Vehicles in Household Comparison
Immigrants from Cuba
Cambodians
5.7%
4 OR MORE VEHICLES IN HOUSEHOLD
1.6/ 100
METRIC RATING
253rd/ 347
METRIC RANK
5.5%
4 OR MORE VEHICLES IN HOUSEHOLD
0.5/ 100
METRIC RATING
275th/ 347
METRIC RANK
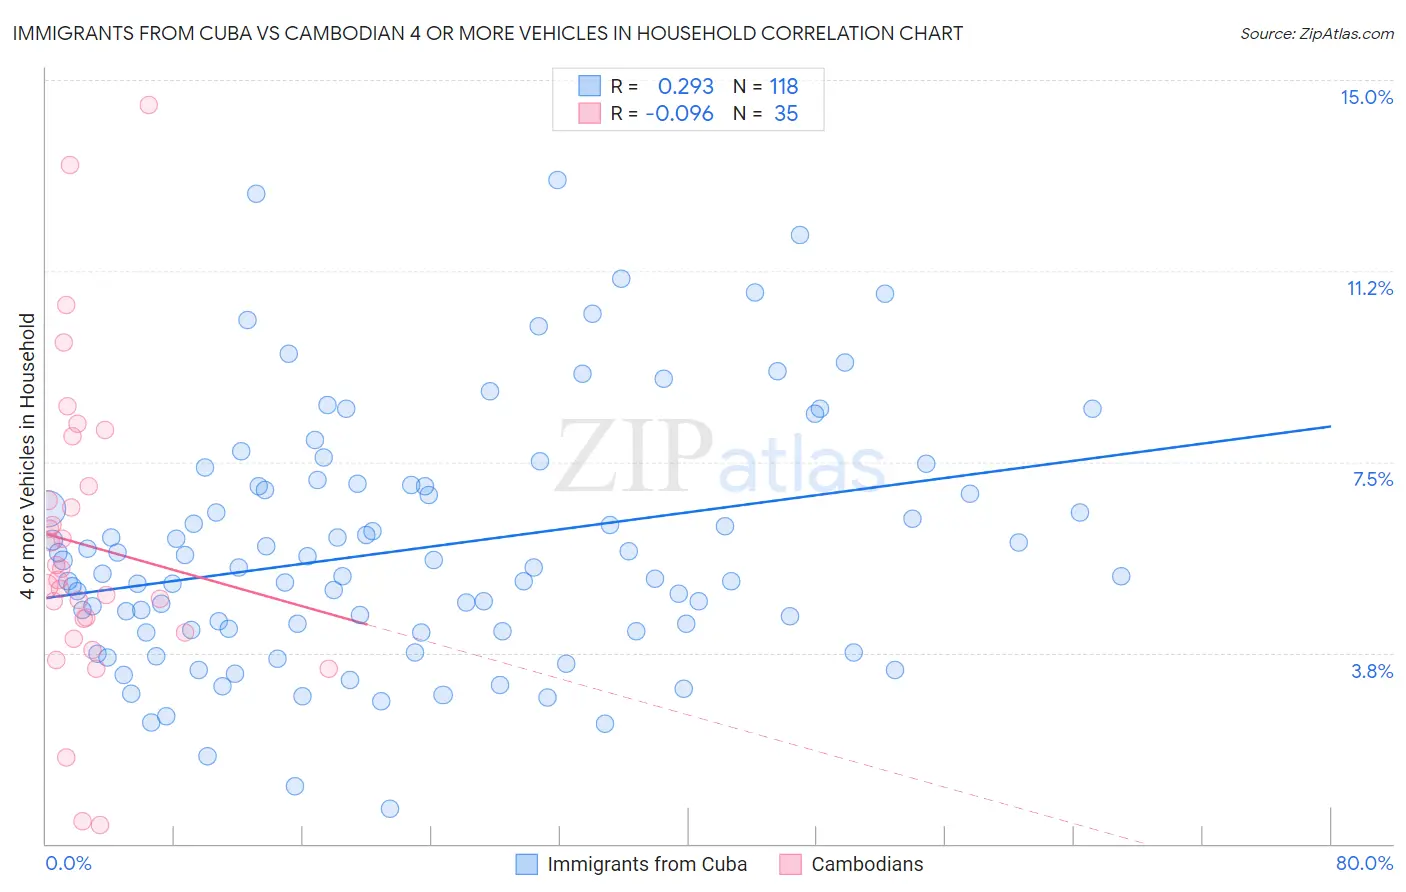
Immigrants from Cuba vs Cambodian 4 or more Vehicles in Household Correlation Chart
The statistical analysis conducted on geographies consisting of 324,547,642 people shows a weak positive correlation between the proportion of Immigrants from Cuba and percentage of households with 4 or more vehicles available in the United States with a correlation coefficient (R) of 0.293 and weighted average of 5.7%. Similarly, the statistical analysis conducted on geographies consisting of 102,385,573 people shows a slight negative correlation between the proportion of Cambodians and percentage of households with 4 or more vehicles available in the United States with a correlation coefficient (R) of -0.096 and weighted average of 5.5%, a difference of 3.3%.
4 or more Vehicles in Household Correlation Summary
| Measurement | Immigrants from Cuba | Cambodian |
| Minimum | 0.68% | 0.37% |
| Maximum | 13.0% | 14.5% |
| Range | 12.4% | 14.1% |
| Mean | 5.8% | 5.9% |
| Median | 5.4% | 5.2% |
| Interquartile 25% (IQ1) | 4.2% | 4.2% |
| Interquartile 75% (IQ3) | 7.0% | 7.0% |
| Interquartile Range (IQR) | 2.8% | 2.9% |
| Standard Deviation (Sample) | 2.4% | 3.0% |
| Standard Deviation (Population) | 2.4% | 3.0% |
Similar Demographics by 4 or more Vehicles in Household
Demographics Similar to Immigrants from Cuba by 4 or more Vehicles in Household
In terms of 4 or more vehicles in household, the demographic groups most similar to Immigrants from Cuba are Immigrants from Panama (5.7%, a difference of 0.14%), Yup'ik (5.7%, a difference of 0.22%), Immigrants from Turkey (5.7%, a difference of 0.26%), Immigrants from Northern Africa (5.6%, a difference of 0.34%), and Immigrants from Lithuania (5.6%, a difference of 0.48%).
| Demographics | Rating | Rank | 4 or more Vehicles in Household |
| Immigrants | North Macedonia | 2.5 /100 | #246 | Tragic 5.7% |
| Immigrants | Ethiopia | 2.4 /100 | #247 | Tragic 5.7% |
| Immigrants | Eastern Africa | 2.4 /100 | #248 | Tragic 5.7% |
| Immigrants | Southern Europe | 2.3 /100 | #249 | Tragic 5.7% |
| Immigrants | Europe | 2.3 /100 | #250 | Tragic 5.7% |
| Ugandans | 2.2 /100 | #251 | Tragic 5.7% |
| Sub-Saharan Africans | 2.1 /100 | #252 | Tragic 5.7% |
| Immigrants | Cuba | 1.6 /100 | #253 | Tragic 5.7% |
| Immigrants | Panama | 1.5 /100 | #254 | Tragic 5.7% |
| Yup'ik | 1.5 /100 | #255 | Tragic 5.7% |
| Immigrants | Turkey | 1.5 /100 | #256 | Tragic 5.7% |
| Immigrants | Northern Africa | 1.4 /100 | #257 | Tragic 5.6% |
| Immigrants | Lithuania | 1.4 /100 | #258 | Tragic 5.6% |
| Immigrants | France | 1.3 /100 | #259 | Tragic 5.6% |
| Uruguayans | 1.3 /100 | #260 | Tragic 5.6% |
Demographics Similar to Cambodians by 4 or more Vehicles in Household
In terms of 4 or more vehicles in household, the demographic groups most similar to Cambodians are Immigrants from Latvia (5.5%, a difference of 0.010%), Black/African American (5.5%, a difference of 0.12%), Immigrants from Bulgaria (5.5%, a difference of 0.13%), Macedonian (5.5%, a difference of 0.24%), and Immigrants from Kazakhstan (5.5%, a difference of 0.27%).
| Demographics | Rating | Rank | 4 or more Vehicles in Household |
| Colombians | 0.7 /100 | #268 | Tragic 5.5% |
| Carpatho Rusyns | 0.7 /100 | #269 | Tragic 5.5% |
| Okinawans | 0.6 /100 | #270 | Tragic 5.5% |
| Immigrants | Sudan | 0.6 /100 | #271 | Tragic 5.5% |
| Immigrants | Kazakhstan | 0.6 /100 | #272 | Tragic 5.5% |
| Macedonians | 0.6 /100 | #273 | Tragic 5.5% |
| Blacks/African Americans | 0.6 /100 | #274 | Tragic 5.5% |
| Cambodians | 0.5 /100 | #275 | Tragic 5.5% |
| Immigrants | Latvia | 0.5 /100 | #276 | Tragic 5.5% |
| Immigrants | Bulgaria | 0.5 /100 | #277 | Tragic 5.5% |
| Immigrants | Eastern Europe | 0.4 /100 | #278 | Tragic 5.4% |
| Immigrants | Uruguay | 0.3 /100 | #279 | Tragic 5.4% |
| Alsatians | 0.3 /100 | #280 | Tragic 5.4% |
| Immigrants | Western Africa | 0.3 /100 | #281 | Tragic 5.4% |
| Immigrants | Spain | 0.3 /100 | #282 | Tragic 5.4% |