Native Hawaiian vs Immigrants from Thailand Unemployment Among Women with Children Ages 6 to 17 years
COMPARE
Native Hawaiian
Immigrants from Thailand
Unemployment Among Women with Children Ages 6 to 17 years
Unemployment Among Women with Children Ages 6 to 17 years Comparison
Native Hawaiians
Immigrants from Thailand
7.9%
UNEMPLOYMENT AMONG WOMEN WITH CHILDREN AGES 6 TO 17 YEARS
100.0/ 100
METRIC RATING
34th/ 347
METRIC RANK
8.3%
UNEMPLOYMENT AMONG WOMEN WITH CHILDREN AGES 6 TO 17 YEARS
99.9/ 100
METRIC RATING
69th/ 347
METRIC RANK
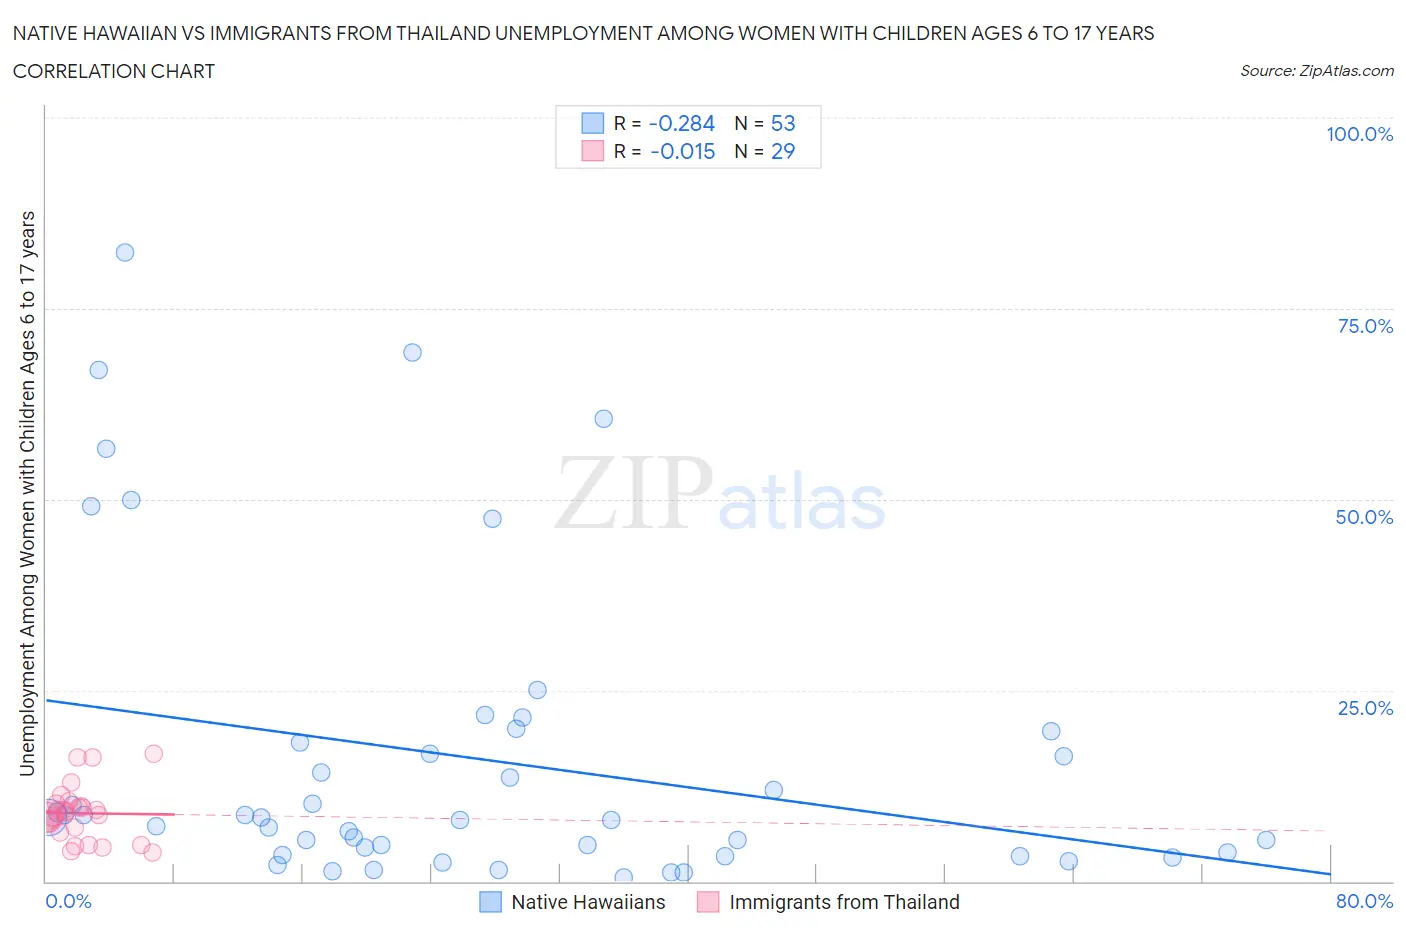
Native Hawaiian vs Immigrants from Thailand Unemployment Among Women with Children Ages 6 to 17 years Correlation Chart
The statistical analysis conducted on geographies consisting of 250,298,235 people shows a weak negative correlation between the proportion of Native Hawaiians and unemployment rate among women with children between the ages 6 and 17 in the United States with a correlation coefficient (R) of -0.284 and weighted average of 7.9%. Similarly, the statistical analysis conducted on geographies consisting of 241,273,781 people shows no correlation between the proportion of Immigrants from Thailand and unemployment rate among women with children between the ages 6 and 17 in the United States with a correlation coefficient (R) of -0.015 and weighted average of 8.3%, a difference of 4.6%.
Unemployment Among Women with Children Ages 6 to 17 years Correlation Summary
| Measurement | Native Hawaiian | Immigrants from Thailand |
| Minimum | 0.50% | 3.7% |
| Maximum | 82.4% | 16.7% |
| Range | 81.9% | 13.0% |
| Mean | 16.2% | 8.9% |
| Median | 8.4% | 9.0% |
| Interquartile 25% (IQ1) | 3.6% | 6.7% |
| Interquartile 75% (IQ3) | 18.9% | 10.0% |
| Interquartile Range (IQR) | 15.4% | 3.2% |
| Standard Deviation (Sample) | 20.2% | 3.5% |
| Standard Deviation (Population) | 20.0% | 3.4% |
Similar Demographics by Unemployment Among Women with Children Ages 6 to 17 years
Demographics Similar to Native Hawaiians by Unemployment Among Women with Children Ages 6 to 17 years
In terms of unemployment among women with children ages 6 to 17 years, the demographic groups most similar to Native Hawaiians are Immigrants from South Central Asia (7.9%, a difference of 0.11%), Burmese (8.0%, a difference of 0.18%), Asian (8.0%, a difference of 0.22%), Immigrants from Korea (7.9%, a difference of 0.28%), and Immigrants from Cambodia (7.9%, a difference of 0.34%).
| Demographics | Rating | Rank | Unemployment Among Women with Children Ages 6 to 17 years |
| Immigrants | Afghanistan | 100.0 /100 | #27 | Exceptional 7.8% |
| Immigrants | Uzbekistan | 100.0 /100 | #28 | Exceptional 7.8% |
| Thais | 100.0 /100 | #29 | Exceptional 7.8% |
| Immigrants | Iran | 100.0 /100 | #30 | Exceptional 7.9% |
| Laotians | 100.0 /100 | #31 | Exceptional 7.9% |
| Immigrants | Cambodia | 100.0 /100 | #32 | Exceptional 7.9% |
| Immigrants | Korea | 100.0 /100 | #33 | Exceptional 7.9% |
| Native Hawaiians | 100.0 /100 | #34 | Exceptional 7.9% |
| Immigrants | South Central Asia | 100.0 /100 | #35 | Exceptional 7.9% |
| Burmese | 100.0 /100 | #36 | Exceptional 8.0% |
| Asians | 100.0 /100 | #37 | Exceptional 8.0% |
| Alsatians | 100.0 /100 | #38 | Exceptional 8.0% |
| Somalis | 100.0 /100 | #39 | Exceptional 8.0% |
| Immigrants | Zimbabwe | 100.0 /100 | #40 | Exceptional 8.0% |
| Iranians | 100.0 /100 | #41 | Exceptional 8.0% |
Demographics Similar to Immigrants from Thailand by Unemployment Among Women with Children Ages 6 to 17 years
In terms of unemployment among women with children ages 6 to 17 years, the demographic groups most similar to Immigrants from Thailand are Marshallese (8.3%, a difference of 0.030%), Norwegian (8.3%, a difference of 0.080%), Armenian (8.3%, a difference of 0.11%), Immigrants from Australia (8.3%, a difference of 0.15%), and Immigrants from Nepal (8.3%, a difference of 0.18%).
| Demographics | Rating | Rank | Unemployment Among Women with Children Ages 6 to 17 years |
| Spanish American Indians | 100.0 /100 | #62 | Exceptional 8.2% |
| Immigrants | South Eastern Asia | 99.9 /100 | #63 | Exceptional 8.2% |
| Immigrants | Kuwait | 99.9 /100 | #64 | Exceptional 8.3% |
| Immigrants | Albania | 99.9 /100 | #65 | Exceptional 8.3% |
| Luxembourgers | 99.9 /100 | #66 | Exceptional 8.3% |
| Armenians | 99.9 /100 | #67 | Exceptional 8.3% |
| Marshallese | 99.9 /100 | #68 | Exceptional 8.3% |
| Immigrants | Thailand | 99.9 /100 | #69 | Exceptional 8.3% |
| Norwegians | 99.9 /100 | #70 | Exceptional 8.3% |
| Immigrants | Australia | 99.8 /100 | #71 | Exceptional 8.3% |
| Immigrants | Nepal | 99.8 /100 | #72 | Exceptional 8.3% |
| Spanish Americans | 99.8 /100 | #73 | Exceptional 8.4% |
| Samoans | 99.7 /100 | #74 | Exceptional 8.4% |
| Immigrants | Sri Lanka | 99.7 /100 | #75 | Exceptional 8.4% |
| Immigrants | Moldova | 99.7 /100 | #76 | Exceptional 8.4% |