Mongolian vs Immigrants from Italy 2nd Grade
COMPARE
Mongolian
Immigrants from Italy
2nd Grade
2nd Grade Comparison
Mongolians
Immigrants from Italy
97.8%
2ND GRADE
26.7/ 100
METRIC RATING
195th/ 347
METRIC RANK
97.9%
2ND GRADE
60.2/ 100
METRIC RATING
162nd/ 347
METRIC RANK
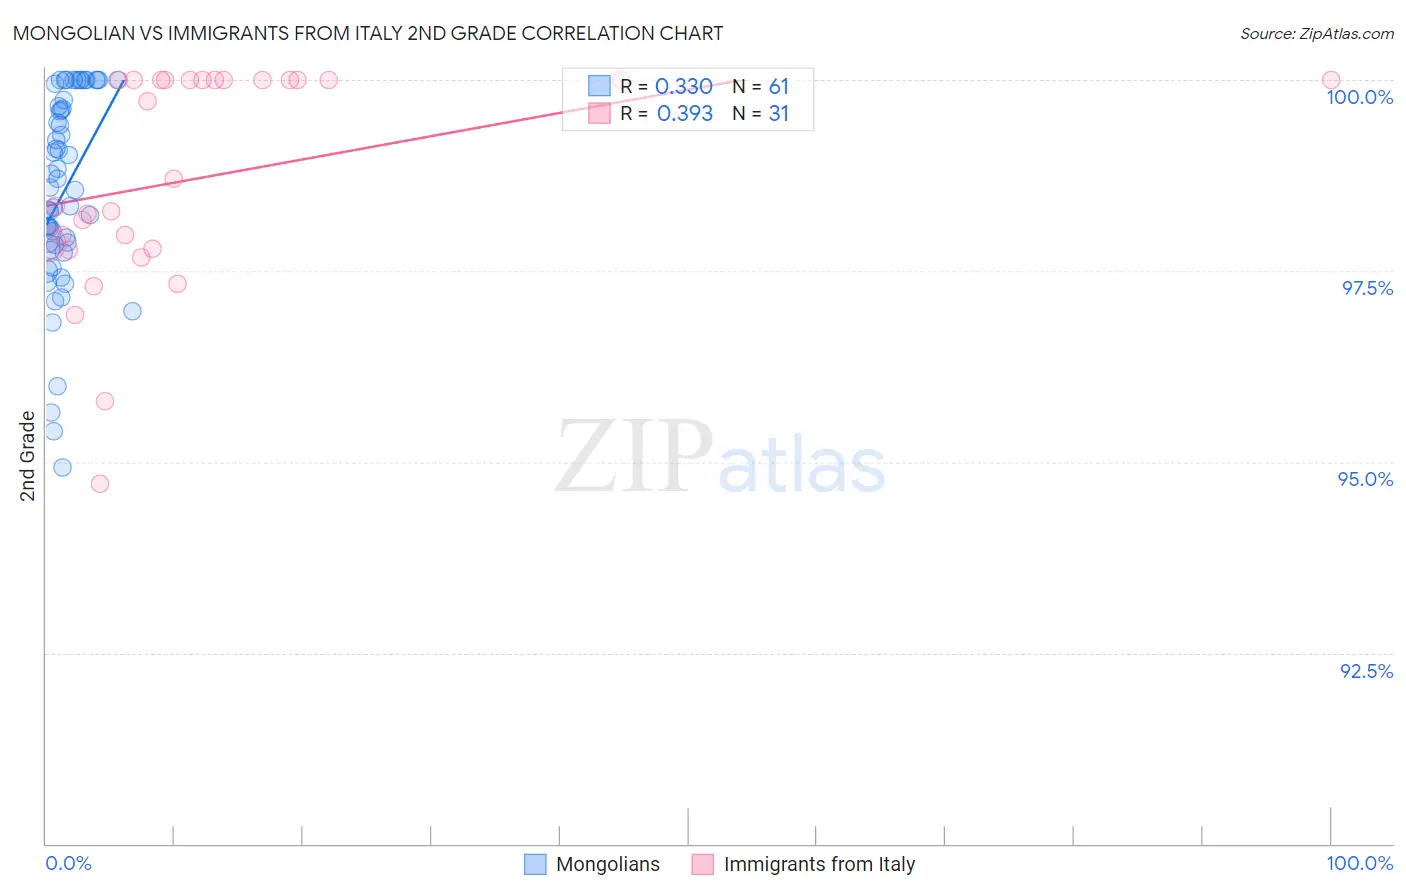
Mongolian vs Immigrants from Italy 2nd Grade Correlation Chart
The statistical analysis conducted on geographies consisting of 140,362,004 people shows a mild positive correlation between the proportion of Mongolians and percentage of population with at least 2nd grade education in the United States with a correlation coefficient (R) of 0.330 and weighted average of 97.8%. Similarly, the statistical analysis conducted on geographies consisting of 324,225,917 people shows a mild positive correlation between the proportion of Immigrants from Italy and percentage of population with at least 2nd grade education in the United States with a correlation coefficient (R) of 0.393 and weighted average of 97.9%, a difference of 0.11%.
2nd Grade Correlation Summary
| Measurement | Mongolian | Immigrants from Italy |
| Minimum | 94.9% | 94.7% |
| Maximum | 100.0% | 100.0% |
| Range | 5.1% | 5.3% |
| Mean | 98.5% | 98.7% |
| Median | 98.6% | 98.7% |
| Interquartile 25% (IQ1) | 97.8% | 97.8% |
| Interquartile 75% (IQ3) | 99.7% | 100.0% |
| Interquartile Range (IQR) | 1.9% | 2.2% |
| Standard Deviation (Sample) | 1.3% | 1.4% |
| Standard Deviation (Population) | 1.3% | 1.4% |
Similar Demographics by 2nd Grade
Demographics Similar to Mongolians by 2nd Grade
In terms of 2nd grade, the demographic groups most similar to Mongolians are Paiute (97.8%, a difference of 0.0%), Immigrants from Kenya (97.8%, a difference of 0.0%), Immigrants from Uganda (97.8%, a difference of 0.0%), Guamanian/Chamorro (97.8%, a difference of 0.0%), and Black/African American (97.8%, a difference of 0.010%).
| Demographics | Rating | Rank | 2nd Grade |
| Immigrants | Kazakhstan | 35.6 /100 | #188 | Fair 97.8% |
| Panamanians | 33.5 /100 | #189 | Fair 97.8% |
| Immigrants | Taiwan | 31.8 /100 | #190 | Fair 97.8% |
| Paraguayans | 30.8 /100 | #191 | Fair 97.8% |
| Blacks/African Americans | 29.9 /100 | #192 | Fair 97.8% |
| Hawaiians | 28.5 /100 | #193 | Fair 97.8% |
| Paiute | 27.0 /100 | #194 | Fair 97.8% |
| Mongolians | 26.7 /100 | #195 | Fair 97.8% |
| Immigrants | Kenya | 26.4 /100 | #196 | Fair 97.8% |
| Immigrants | Uganda | 26.3 /100 | #197 | Fair 97.8% |
| Guamanians/Chamorros | 25.7 /100 | #198 | Fair 97.8% |
| Immigrants | Egypt | 24.4 /100 | #199 | Fair 97.8% |
| Immigrants | Lebanon | 20.9 /100 | #200 | Fair 97.8% |
| Tohono O'odham | 20.9 /100 | #201 | Fair 97.8% |
| Immigrants | Ukraine | 20.5 /100 | #202 | Fair 97.8% |
Demographics Similar to Immigrants from Italy by 2nd Grade
In terms of 2nd grade, the demographic groups most similar to Immigrants from Italy are Immigrants from Eastern Europe (97.9%, a difference of 0.0%), Immigrants from Russia (97.9%, a difference of 0.0%), Bermudan (97.9%, a difference of 0.0%), French American Indian (97.9%, a difference of 0.010%), and Dutch West Indian (97.9%, a difference of 0.010%).
| Demographics | Rating | Rank | 2nd Grade |
| French American Indians | 64.3 /100 | #155 | Good 97.9% |
| Dutch West Indians | 63.8 /100 | #156 | Good 97.9% |
| Venezuelans | 63.3 /100 | #157 | Good 97.9% |
| Immigrants | Iran | 62.8 /100 | #158 | Good 97.9% |
| Comanche | 62.8 /100 | #159 | Good 97.9% |
| Immigrants | Eastern Europe | 61.1 /100 | #160 | Good 97.9% |
| Immigrants | Russia | 60.3 /100 | #161 | Good 97.9% |
| Immigrants | Italy | 60.2 /100 | #162 | Good 97.9% |
| Bermudans | 59.4 /100 | #163 | Average 97.9% |
| Ugandans | 56.6 /100 | #164 | Average 97.9% |
| Spanish Americans | 56.4 /100 | #165 | Average 97.9% |
| Immigrants | Jordan | 56.3 /100 | #166 | Average 97.9% |
| Chileans | 56.1 /100 | #167 | Average 97.9% |
| Brazilians | 55.8 /100 | #168 | Average 97.9% |
| Immigrants | Spain | 55.4 /100 | #169 | Average 97.9% |