Menominee vs Immigrants from Denmark 1 or more Vehicles in Household
COMPARE
Menominee
Immigrants from Denmark
1 or more Vehicles in Household
1 or more Vehicles in Household Comparison
Menominee
Immigrants from Denmark
88.3%
1 OR MORE VEHICLES IN HOUSEHOLD
1.9/ 100
METRIC RATING
246th/ 347
METRIC RANK
89.1%
1 OR MORE VEHICLES IN HOUSEHOLD
14.8/ 100
METRIC RATING
207th/ 347
METRIC RANK
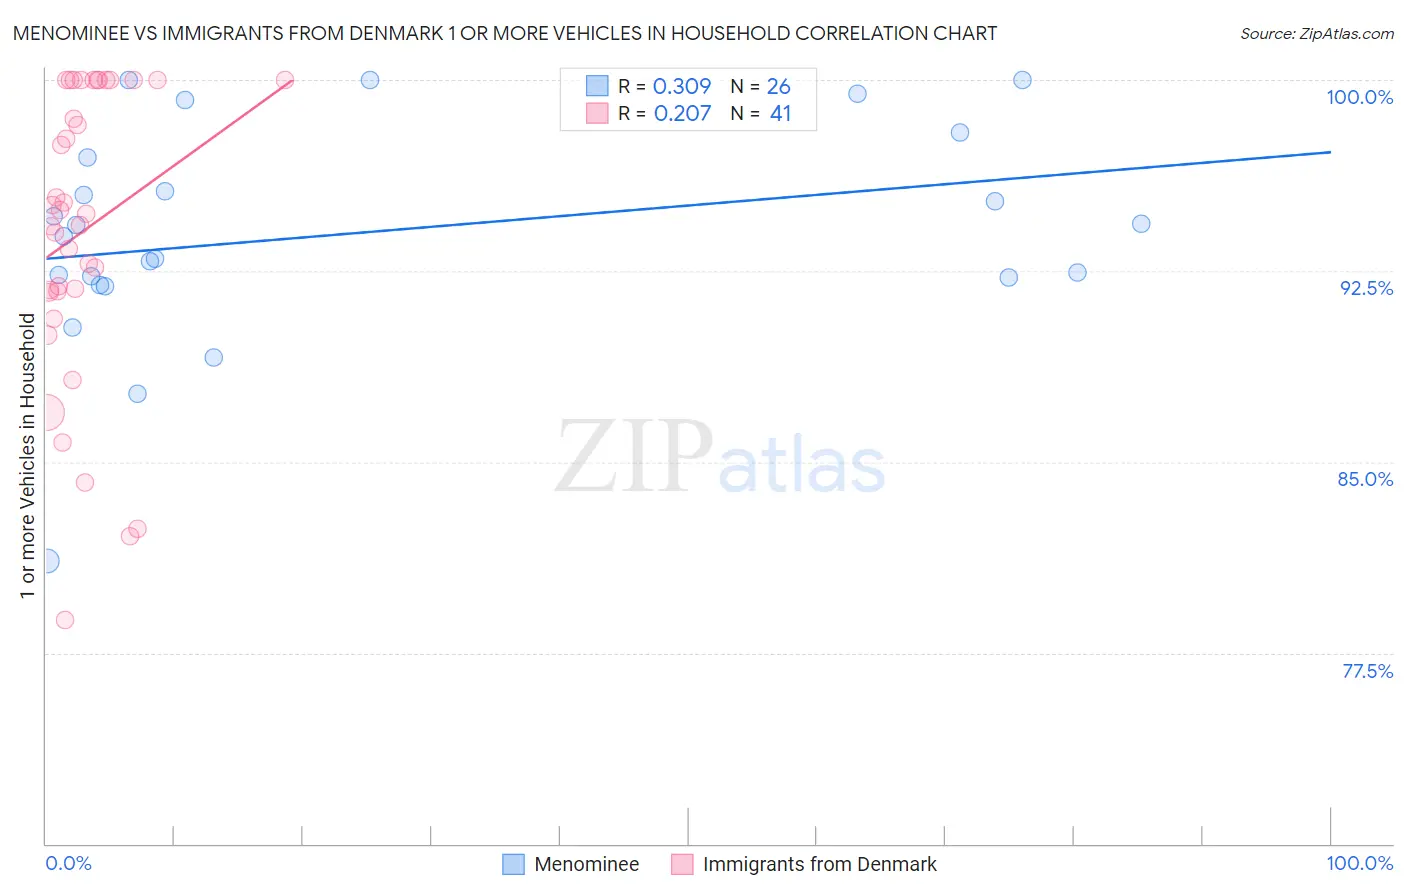
Menominee vs Immigrants from Denmark 1 or more Vehicles in Household Correlation Chart
The statistical analysis conducted on geographies consisting of 45,777,849 people shows a mild positive correlation between the proportion of Menominee and percentage of households with 1 or more vehicles available in the United States with a correlation coefficient (R) of 0.309 and weighted average of 88.3%. Similarly, the statistical analysis conducted on geographies consisting of 136,405,039 people shows a weak positive correlation between the proportion of Immigrants from Denmark and percentage of households with 1 or more vehicles available in the United States with a correlation coefficient (R) of 0.207 and weighted average of 89.1%, a difference of 0.87%.
1 or more Vehicles in Household Correlation Summary
| Measurement | Menominee | Immigrants from Denmark |
| Minimum | 81.1% | 78.8% |
| Maximum | 100.0% | 100.0% |
| Range | 18.9% | 21.2% |
| Mean | 94.0% | 94.1% |
| Median | 94.1% | 94.8% |
| Interquartile 25% (IQ1) | 92.2% | 91.7% |
| Interquartile 75% (IQ3) | 97.0% | 100.0% |
| Interquartile Range (IQR) | 4.7% | 8.3% |
| Standard Deviation (Sample) | 4.3% | 5.7% |
| Standard Deviation (Population) | 4.2% | 5.7% |
Similar Demographics by 1 or more Vehicles in Household
Demographics Similar to Menominee by 1 or more Vehicles in Household
In terms of 1 or more vehicles in household, the demographic groups most similar to Menominee are Immigrants from Czechoslovakia (88.3%, a difference of 0.010%), Immigrants from Portugal (88.3%, a difference of 0.030%), Immigrants from Honduras (88.3%, a difference of 0.040%), Immigrants from Belgium (88.4%, a difference of 0.050%), and Immigrants from Nigeria (88.2%, a difference of 0.080%).
| Demographics | Rating | Rank | 1 or more Vehicles in Household |
| Kiowa | 3.8 /100 | #239 | Tragic 88.6% |
| Eastern Europeans | 3.0 /100 | #240 | Tragic 88.5% |
| Taiwanese | 2.6 /100 | #241 | Tragic 88.4% |
| Turks | 2.5 /100 | #242 | Tragic 88.4% |
| Immigrants | Belgium | 2.1 /100 | #243 | Tragic 88.4% |
| Immigrants | Portugal | 2.0 /100 | #244 | Tragic 88.3% |
| Immigrants | Czechoslovakia | 1.9 /100 | #245 | Tragic 88.3% |
| Menominee | 1.9 /100 | #246 | Tragic 88.3% |
| Immigrants | Honduras | 1.7 /100 | #247 | Tragic 88.3% |
| Immigrants | Nigeria | 1.5 /100 | #248 | Tragic 88.2% |
| Blacks/African Americans | 1.4 /100 | #249 | Tragic 88.2% |
| Egyptians | 1.2 /100 | #250 | Tragic 88.2% |
| Immigrants | Serbia | 1.2 /100 | #251 | Tragic 88.2% |
| Immigrants | Uruguay | 1.1 /100 | #252 | Tragic 88.1% |
| Hondurans | 1.0 /100 | #253 | Tragic 88.1% |
Demographics Similar to Immigrants from Denmark by 1 or more Vehicles in Household
In terms of 1 or more vehicles in household, the demographic groups most similar to Immigrants from Denmark are Immigrants from Chile (89.1%, a difference of 0.010%), Immigrants from Italy (89.1%, a difference of 0.030%), Apache (89.1%, a difference of 0.040%), Dutch West Indian (89.0%, a difference of 0.040%), and Sierra Leonean (89.0%, a difference of 0.060%).
| Demographics | Rating | Rank | 1 or more Vehicles in Household |
| Central Americans | 21.4 /100 | #200 | Fair 89.2% |
| Immigrants | Western Europe | 20.5 /100 | #201 | Fair 89.2% |
| Iroquois | 19.8 /100 | #202 | Poor 89.2% |
| Cambodians | 18.9 /100 | #203 | Poor 89.2% |
| Romanians | 18.2 /100 | #204 | Poor 89.2% |
| Guatemalans | 17.8 /100 | #205 | Poor 89.2% |
| Apache | 16.2 /100 | #206 | Poor 89.1% |
| Immigrants | Denmark | 14.8 /100 | #207 | Poor 89.1% |
| Immigrants | Chile | 14.4 /100 | #208 | Poor 89.1% |
| Immigrants | Italy | 14.0 /100 | #209 | Poor 89.1% |
| Dutch West Indians | 13.5 /100 | #210 | Poor 89.0% |
| Sierra Leoneans | 13.0 /100 | #211 | Poor 89.0% |
| Somalis | 12.8 /100 | #212 | Poor 89.0% |
| Immigrants | Western Asia | 12.3 /100 | #213 | Poor 89.0% |
| Immigrants | Hungary | 11.9 /100 | #214 | Poor 89.0% |