Malaysian vs Immigrants from Ireland 4 or more Vehicles in Household
COMPARE
Malaysian
Immigrants from Ireland
4 or more Vehicles in Household
4 or more Vehicles in Household Comparison
Malaysians
Immigrants from Ireland
7.7%
4 OR MORE VEHICLES IN HOUSEHOLD
100.0/ 100
METRIC RATING
53rd/ 347
METRIC RANK
5.4%
4 OR MORE VEHICLES IN HOUSEHOLD
0.3/ 100
METRIC RATING
283rd/ 347
METRIC RANK
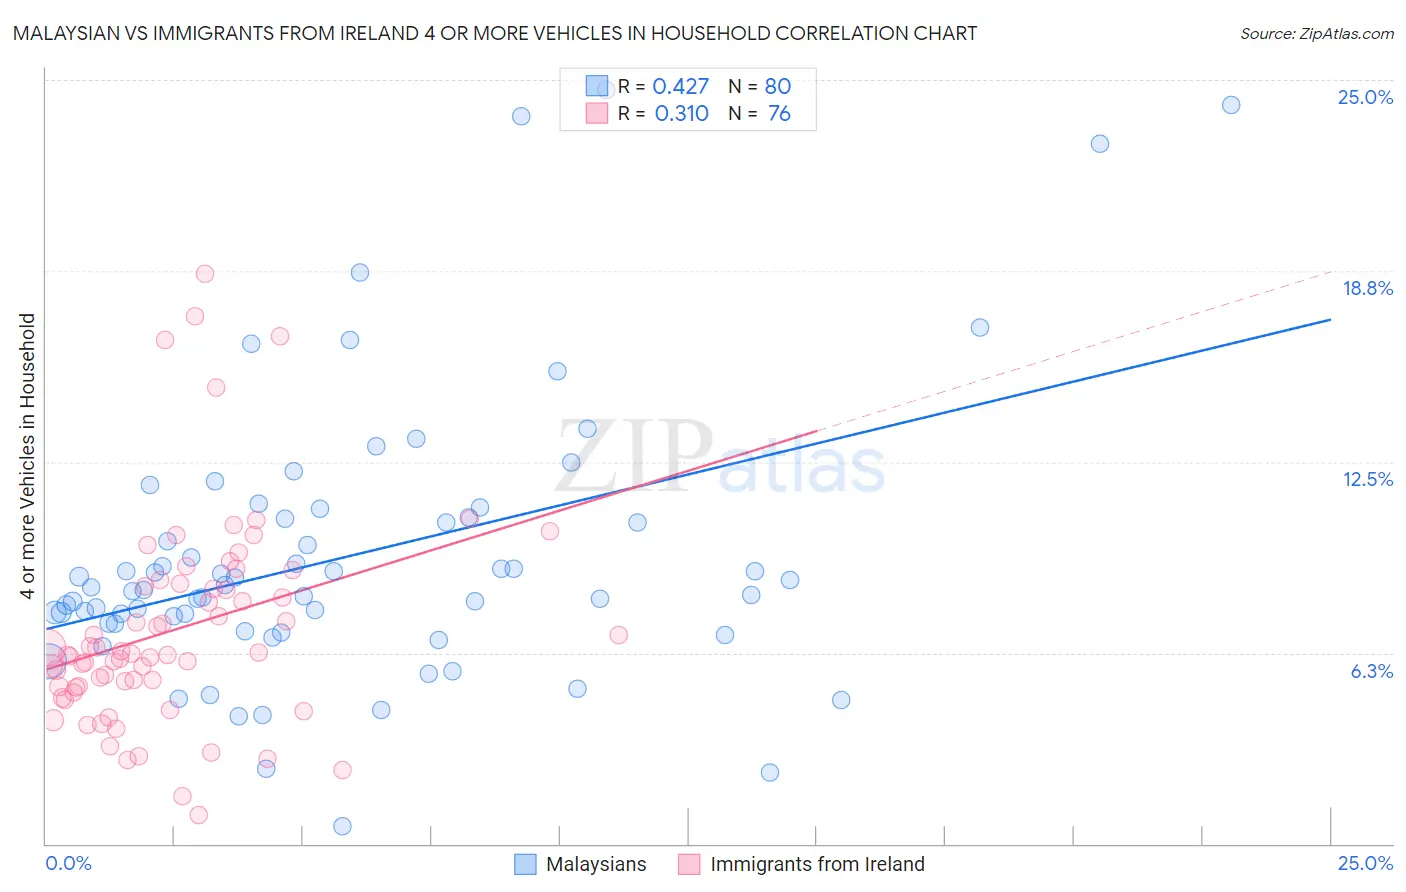
Malaysian vs Immigrants from Ireland 4 or more Vehicles in Household Correlation Chart
The statistical analysis conducted on geographies consisting of 225,515,285 people shows a moderate positive correlation between the proportion of Malaysians and percentage of households with 4 or more vehicles available in the United States with a correlation coefficient (R) of 0.427 and weighted average of 7.7%. Similarly, the statistical analysis conducted on geographies consisting of 239,720,529 people shows a mild positive correlation between the proportion of Immigrants from Ireland and percentage of households with 4 or more vehicles available in the United States with a correlation coefficient (R) of 0.310 and weighted average of 5.4%, a difference of 42.1%.
4 or more Vehicles in Household Correlation Summary
| Measurement | Malaysian | Immigrants from Ireland |
| Minimum | 0.58% | 0.96% |
| Maximum | 24.7% | 18.7% |
| Range | 24.1% | 17.7% |
| Mean | 9.4% | 7.0% |
| Median | 8.3% | 6.2% |
| Interquartile 25% (IQ1) | 7.2% | 5.1% |
| Interquartile 75% (IQ3) | 10.6% | 8.5% |
| Interquartile Range (IQR) | 3.4% | 3.3% |
| Standard Deviation (Sample) | 4.6% | 3.4% |
| Standard Deviation (Population) | 4.6% | 3.4% |
Similar Demographics by 4 or more Vehicles in Household
Demographics Similar to Malaysians by 4 or more Vehicles in Household
In terms of 4 or more vehicles in household, the demographic groups most similar to Malaysians are Dutch (7.7%, a difference of 0.070%), Japanese (7.7%, a difference of 0.38%), Immigrants from Oceania (7.6%, a difference of 0.47%), English (7.6%, a difference of 0.48%), and Immigrants from Laos (7.7%, a difference of 0.50%).
| Demographics | Rating | Rank | 4 or more Vehicles in Household |
| Crow | 100.0 /100 | #46 | Exceptional 7.8% |
| Osage | 100.0 /100 | #47 | Exceptional 7.8% |
| Swiss | 100.0 /100 | #48 | Exceptional 7.8% |
| Cherokee | 100.0 /100 | #49 | Exceptional 7.7% |
| Immigrants | El Salvador | 100.0 /100 | #50 | Exceptional 7.7% |
| Immigrants | Laos | 100.0 /100 | #51 | Exceptional 7.7% |
| Japanese | 100.0 /100 | #52 | Exceptional 7.7% |
| Malaysians | 100.0 /100 | #53 | Exceptional 7.7% |
| Dutch | 100.0 /100 | #54 | Exceptional 7.7% |
| Immigrants | Oceania | 100.0 /100 | #55 | Exceptional 7.6% |
| English | 100.0 /100 | #56 | Exceptional 7.6% |
| Pennsylvania Germans | 100.0 /100 | #57 | Exceptional 7.6% |
| Swedes | 100.0 /100 | #58 | Exceptional 7.6% |
| Hispanics or Latinos | 100.0 /100 | #59 | Exceptional 7.6% |
| Spaniards | 100.0 /100 | #60 | Exceptional 7.6% |
Demographics Similar to Immigrants from Ireland by 4 or more Vehicles in Household
In terms of 4 or more vehicles in household, the demographic groups most similar to Immigrants from Ireland are Immigrants from Spain (5.4%, a difference of 0.080%), Immigrants from Western Africa (5.4%, a difference of 0.25%), Brazilian (5.4%, a difference of 0.29%), Alsatian (5.4%, a difference of 0.32%), and Immigrants from Uruguay (5.4%, a difference of 0.33%).
| Demographics | Rating | Rank | 4 or more Vehicles in Household |
| Immigrants | Latvia | 0.5 /100 | #276 | Tragic 5.5% |
| Immigrants | Bulgaria | 0.5 /100 | #277 | Tragic 5.5% |
| Immigrants | Eastern Europe | 0.4 /100 | #278 | Tragic 5.4% |
| Immigrants | Uruguay | 0.3 /100 | #279 | Tragic 5.4% |
| Alsatians | 0.3 /100 | #280 | Tragic 5.4% |
| Immigrants | Western Africa | 0.3 /100 | #281 | Tragic 5.4% |
| Immigrants | Spain | 0.3 /100 | #282 | Tragic 5.4% |
| Immigrants | Ireland | 0.3 /100 | #283 | Tragic 5.4% |
| Brazilians | 0.3 /100 | #284 | Tragic 5.4% |
| Immigrants | Liberia | 0.2 /100 | #285 | Tragic 5.4% |
| Immigrants | Colombia | 0.2 /100 | #286 | Tragic 5.4% |
| Immigrants | Croatia | 0.2 /100 | #287 | Tragic 5.4% |
| Venezuelans | 0.2 /100 | #288 | Tragic 5.3% |
| Immigrants | Bosnia and Herzegovina | 0.2 /100 | #289 | Tragic 5.3% |
| Immigrants | Russia | 0.2 /100 | #290 | Tragic 5.3% |