Malaysian vs Polish 4 or more Vehicles in Household
COMPARE
Malaysian
Polish
4 or more Vehicles in Household
4 or more Vehicles in Household Comparison
Malaysians
Poles
7.7%
4 OR MORE VEHICLES IN HOUSEHOLD
100.0/ 100
METRIC RATING
53rd/ 347
METRIC RANK
6.4%
4 OR MORE VEHICLES IN HOUSEHOLD
56.9/ 100
METRIC RATING
167th/ 347
METRIC RANK
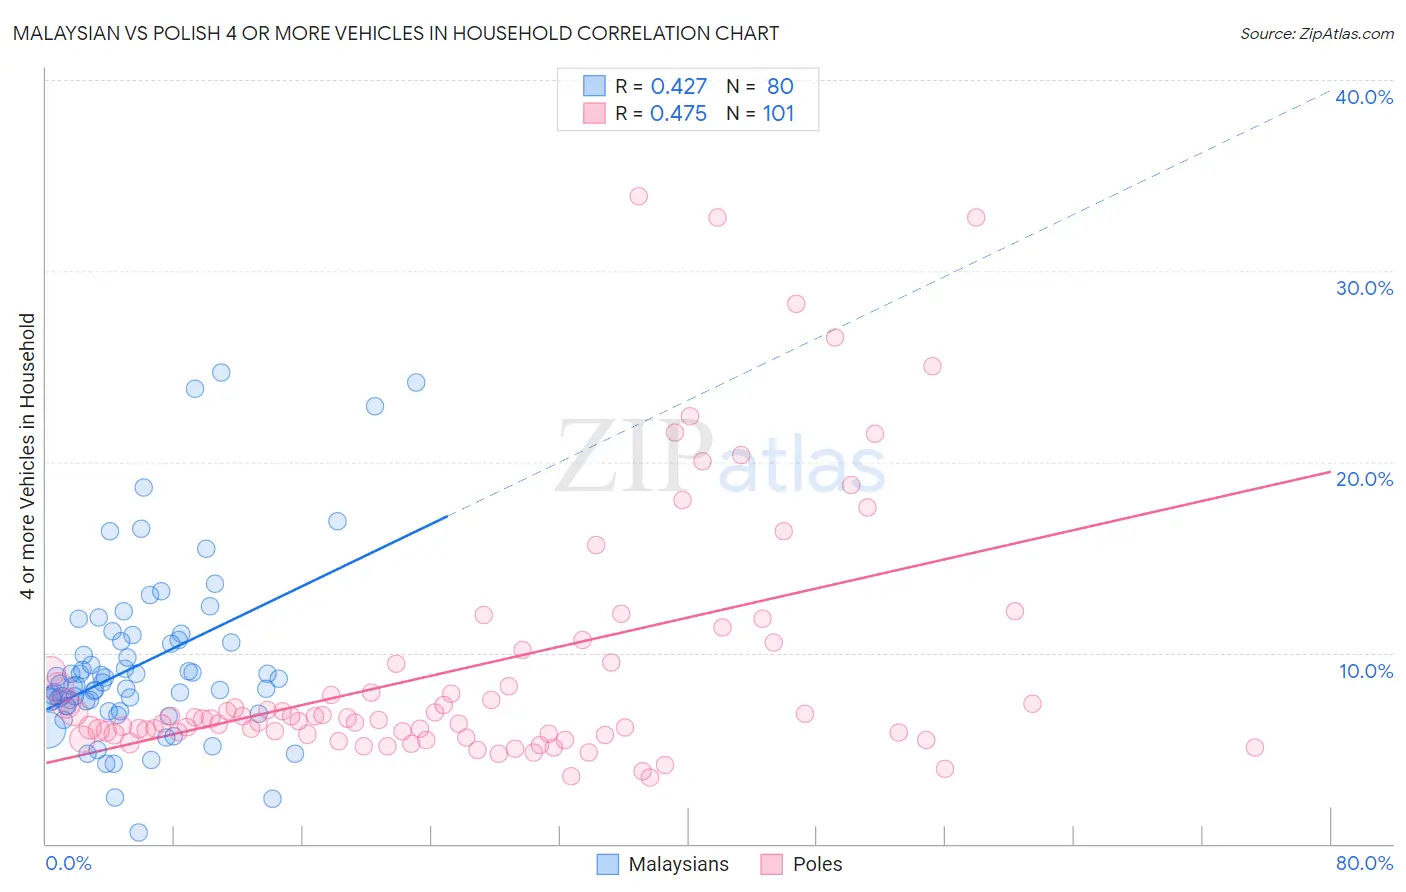
Malaysian vs Polish 4 or more Vehicles in Household Correlation Chart
The statistical analysis conducted on geographies consisting of 225,515,285 people shows a moderate positive correlation between the proportion of Malaysians and percentage of households with 4 or more vehicles available in the United States with a correlation coefficient (R) of 0.427 and weighted average of 7.7%. Similarly, the statistical analysis conducted on geographies consisting of 557,050,036 people shows a moderate positive correlation between the proportion of Poles and percentage of households with 4 or more vehicles available in the United States with a correlation coefficient (R) of 0.475 and weighted average of 6.4%, a difference of 20.3%.
4 or more Vehicles in Household Correlation Summary
| Measurement | Malaysian | Polish |
| Minimum | 0.58% | 3.5% |
| Maximum | 24.7% | 33.9% |
| Range | 24.1% | 30.4% |
| Mean | 9.4% | 9.3% |
| Median | 8.3% | 6.6% |
| Interquartile 25% (IQ1) | 7.2% | 5.7% |
| Interquartile 75% (IQ3) | 10.6% | 9.5% |
| Interquartile Range (IQR) | 3.4% | 3.7% |
| Standard Deviation (Sample) | 4.6% | 6.7% |
| Standard Deviation (Population) | 4.6% | 6.7% |
Similar Demographics by 4 or more Vehicles in Household
Demographics Similar to Malaysians by 4 or more Vehicles in Household
In terms of 4 or more vehicles in household, the demographic groups most similar to Malaysians are Dutch (7.7%, a difference of 0.070%), Japanese (7.7%, a difference of 0.38%), Immigrants from Oceania (7.6%, a difference of 0.47%), English (7.6%, a difference of 0.48%), and Immigrants from Laos (7.7%, a difference of 0.50%).
| Demographics | Rating | Rank | 4 or more Vehicles in Household |
| Crow | 100.0 /100 | #46 | Exceptional 7.8% |
| Osage | 100.0 /100 | #47 | Exceptional 7.8% |
| Swiss | 100.0 /100 | #48 | Exceptional 7.8% |
| Cherokee | 100.0 /100 | #49 | Exceptional 7.7% |
| Immigrants | El Salvador | 100.0 /100 | #50 | Exceptional 7.7% |
| Immigrants | Laos | 100.0 /100 | #51 | Exceptional 7.7% |
| Japanese | 100.0 /100 | #52 | Exceptional 7.7% |
| Malaysians | 100.0 /100 | #53 | Exceptional 7.7% |
| Dutch | 100.0 /100 | #54 | Exceptional 7.7% |
| Immigrants | Oceania | 100.0 /100 | #55 | Exceptional 7.6% |
| English | 100.0 /100 | #56 | Exceptional 7.6% |
| Pennsylvania Germans | 100.0 /100 | #57 | Exceptional 7.6% |
| Swedes | 100.0 /100 | #58 | Exceptional 7.6% |
| Hispanics or Latinos | 100.0 /100 | #59 | Exceptional 7.6% |
| Spaniards | 100.0 /100 | #60 | Exceptional 7.6% |
Demographics Similar to Poles by 4 or more Vehicles in Household
In terms of 4 or more vehicles in household, the demographic groups most similar to Poles are Immigrants from Denmark (6.4%, a difference of 0.10%), Lebanese (6.4%, a difference of 0.11%), Estonian (6.4%, a difference of 0.18%), Immigrants from Peru (6.4%, a difference of 0.31%), and Immigrants from Syria (6.3%, a difference of 0.42%).
| Demographics | Rating | Rank | 4 or more Vehicles in Household |
| Palestinians | 65.8 /100 | #160 | Good 6.4% |
| Immigrants | Cameroon | 64.4 /100 | #161 | Good 6.4% |
| Immigrants | Pakistan | 63.2 /100 | #162 | Good 6.4% |
| Chileans | 61.2 /100 | #163 | Good 6.4% |
| Hungarians | 61.1 /100 | #164 | Good 6.4% |
| Immigrants | Peru | 59.8 /100 | #165 | Average 6.4% |
| Immigrants | Denmark | 57.8 /100 | #166 | Average 6.4% |
| Poles | 56.9 /100 | #167 | Average 6.4% |
| Lebanese | 55.8 /100 | #168 | Average 6.4% |
| Estonians | 55.1 /100 | #169 | Average 6.4% |
| Immigrants | Syria | 52.8 /100 | #170 | Average 6.3% |
| Immigrants | India | 51.9 /100 | #171 | Average 6.3% |
| Immigrants | Lebanon | 51.7 /100 | #172 | Average 6.3% |
| Slovenes | 51.1 /100 | #173 | Average 6.3% |
| Lithuanians | 50.0 /100 | #174 | Average 6.3% |