Lumbee vs Tsimshian Unemployment Among Ages 25 to 29 years
COMPARE
Lumbee
Tsimshian
Unemployment Among Ages 25 to 29 years
Unemployment Among Ages 25 to 29 years Comparison
Lumbee
Tsimshian
11.2%
UNEMPLOYMENT AMONG AGES 25 TO 29 YEARS
0.0/ 100
METRIC RATING
336th/ 347
METRIC RANK
8.0%
UNEMPLOYMENT AMONG AGES 25 TO 29 YEARS
0.0/ 100
METRIC RATING
305th/ 347
METRIC RANK
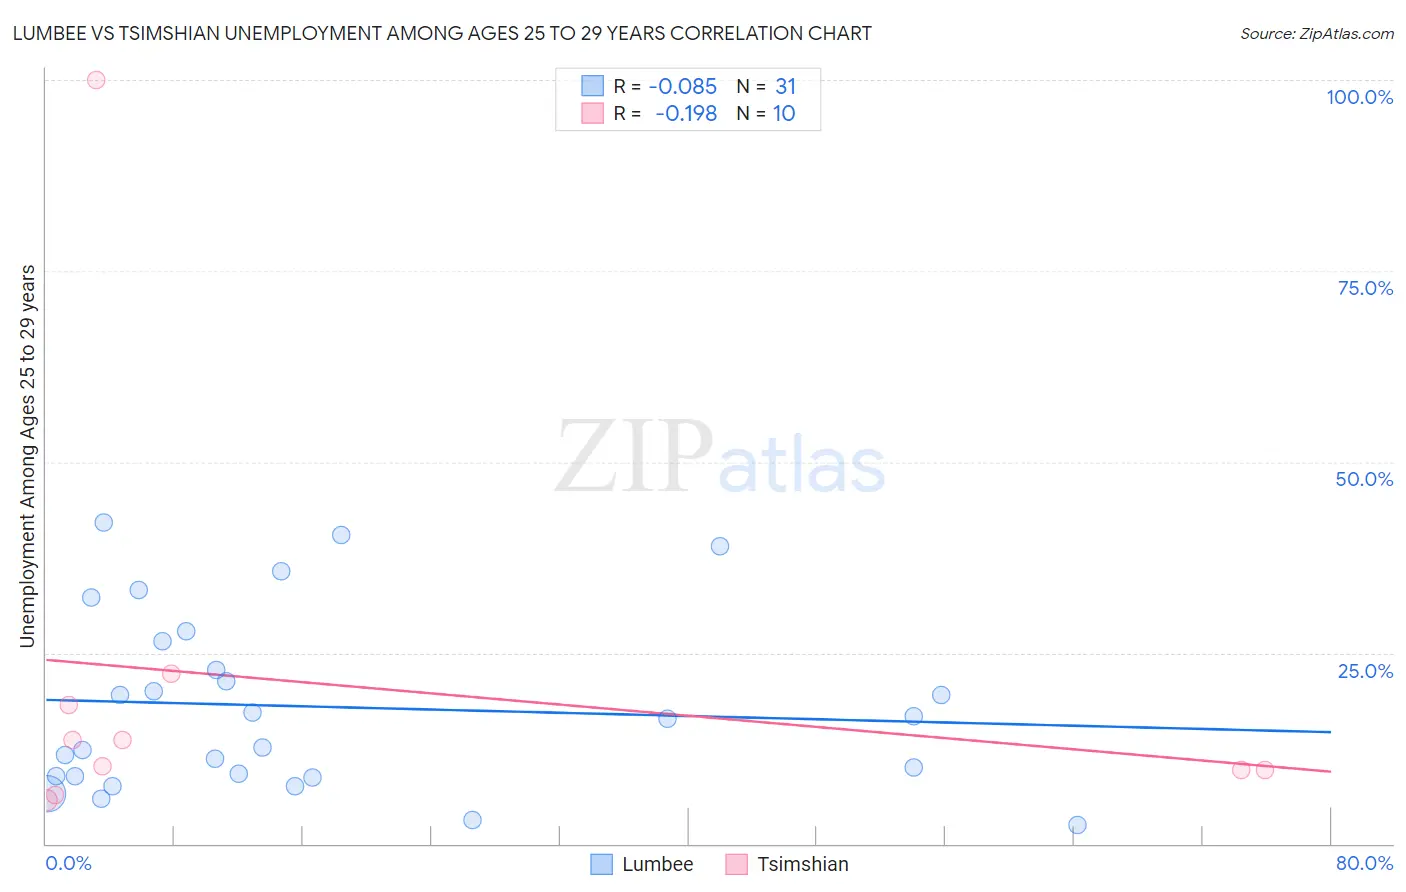
Lumbee vs Tsimshian Unemployment Among Ages 25 to 29 years Correlation Chart
The statistical analysis conducted on geographies consisting of 90,454,801 people shows a slight negative correlation between the proportion of Lumbee and unemployment rate among population between the ages 25 and 29 in the United States with a correlation coefficient (R) of -0.085 and weighted average of 11.2%. Similarly, the statistical analysis conducted on geographies consisting of 15,388,943 people shows a poor negative correlation between the proportion of Tsimshian and unemployment rate among population between the ages 25 and 29 in the United States with a correlation coefficient (R) of -0.198 and weighted average of 8.0%, a difference of 40.0%.
Unemployment Among Ages 25 to 29 years Correlation Summary
| Measurement | Lumbee | Tsimshian |
| Minimum | 2.4% | 5.7% |
| Maximum | 42.0% | 100.0% |
| Range | 39.6% | 94.3% |
| Mean | 17.9% | 20.9% |
| Median | 16.3% | 11.9% |
| Interquartile 25% (IQ1) | 8.8% | 9.6% |
| Interquartile 75% (IQ3) | 26.6% | 18.2% |
| Interquartile Range (IQR) | 17.8% | 8.6% |
| Standard Deviation (Sample) | 11.5% | 28.3% |
| Standard Deviation (Population) | 11.4% | 26.8% |
Similar Demographics by Unemployment Among Ages 25 to 29 years
Demographics Similar to Lumbee by Unemployment Among Ages 25 to 29 years
In terms of unemployment among ages 25 to 29 years, the demographic groups most similar to Lumbee are Menominee (11.3%, a difference of 0.28%), Puerto Rican (11.1%, a difference of 1.1%), Yuman (11.0%, a difference of 2.2%), Sioux (11.7%, a difference of 3.8%), and Alaskan Athabascan (10.8%, a difference of 4.2%).
| Demographics | Rating | Rank | Unemployment Among Ages 25 to 29 years |
| Aleuts | 0.0 /100 | #329 | Tragic 9.7% |
| Natives/Alaskans | 0.0 /100 | #330 | Tragic 9.8% |
| Alaska Natives | 0.0 /100 | #331 | Tragic 10.2% |
| Pueblo | 0.0 /100 | #332 | Tragic 10.4% |
| Alaskan Athabascans | 0.0 /100 | #333 | Tragic 10.8% |
| Yuman | 0.0 /100 | #334 | Tragic 11.0% |
| Puerto Ricans | 0.0 /100 | #335 | Tragic 11.1% |
| Lumbee | 0.0 /100 | #336 | Tragic 11.2% |
| Menominee | 0.0 /100 | #337 | Tragic 11.3% |
| Sioux | 0.0 /100 | #338 | Tragic 11.7% |
| Pima | 0.0 /100 | #339 | Tragic 11.8% |
| Cheyenne | 0.0 /100 | #340 | Tragic 11.8% |
| Tohono O'odham | 0.0 /100 | #341 | Tragic 12.1% |
| Navajo | 0.0 /100 | #342 | Tragic 12.2% |
| Inupiat | 0.0 /100 | #343 | Tragic 13.4% |
Demographics Similar to Tsimshian by Unemployment Among Ages 25 to 29 years
In terms of unemployment among ages 25 to 29 years, the demographic groups most similar to Tsimshian are Haitian (8.0%, a difference of 0.080%), Immigrants from Barbados (8.0%, a difference of 0.24%), Cajun (8.0%, a difference of 0.26%), Immigrants from Yemen (8.0%, a difference of 0.48%), and Immigrants from Jamaica (8.1%, a difference of 0.66%).
| Demographics | Rating | Rank | Unemployment Among Ages 25 to 29 years |
| Immigrants | Trinidad and Tobago | 0.0 /100 | #298 | Tragic 7.9% |
| Barbadians | 0.0 /100 | #299 | Tragic 7.9% |
| Central American Indians | 0.0 /100 | #300 | Tragic 7.9% |
| West Indians | 0.0 /100 | #301 | Tragic 7.9% |
| Jamaicans | 0.0 /100 | #302 | Tragic 7.9% |
| Immigrants | Yemen | 0.0 /100 | #303 | Tragic 8.0% |
| Cajuns | 0.0 /100 | #304 | Tragic 8.0% |
| Tsimshian | 0.0 /100 | #305 | Tragic 8.0% |
| Haitians | 0.0 /100 | #306 | Tragic 8.0% |
| Immigrants | Barbados | 0.0 /100 | #307 | Tragic 8.0% |
| Immigrants | Jamaica | 0.0 /100 | #308 | Tragic 8.1% |
| Immigrants | Haiti | 0.0 /100 | #309 | Tragic 8.1% |
| U.S. Virgin Islanders | 0.0 /100 | #310 | Tragic 8.1% |
| Immigrants | Azores | 0.0 /100 | #311 | Tragic 8.1% |
| Dutch West Indians | 0.0 /100 | #312 | Tragic 8.2% |