Liberian vs Immigrants 1 or more Vehicles in Household
COMPARE
Liberian
Immigrants
1 or more Vehicles in Household
1 or more Vehicles in Household Comparison
Liberians
Immigrants
88.0%
1 OR MORE VEHICLES IN HOUSEHOLD
0.9/ 100
METRIC RATING
257th/ 347
METRIC RANK
90.1%
1 OR MORE VEHICLES IN HOUSEHOLD
73.6/ 100
METRIC RATING
155th/ 347
METRIC RANK
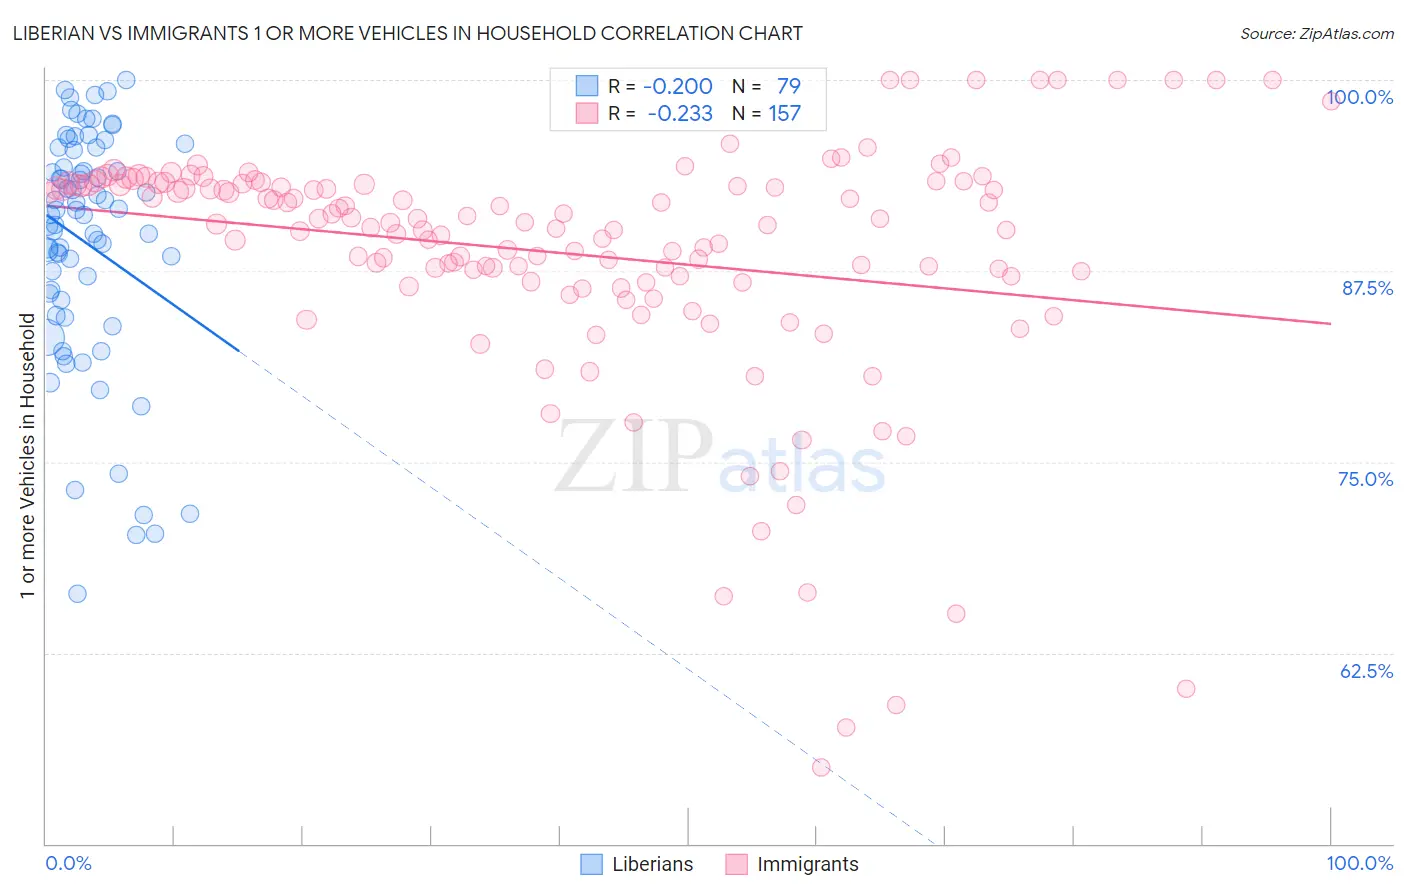
Liberian vs Immigrants 1 or more Vehicles in Household Correlation Chart
The statistical analysis conducted on geographies consisting of 118,045,593 people shows a poor negative correlation between the proportion of Liberians and percentage of households with 1 or more vehicles available in the United States with a correlation coefficient (R) of -0.200 and weighted average of 88.0%. Similarly, the statistical analysis conducted on geographies consisting of 566,737,688 people shows a weak negative correlation between the proportion of Immigrants and percentage of households with 1 or more vehicles available in the United States with a correlation coefficient (R) of -0.233 and weighted average of 90.1%, a difference of 2.3%.
1 or more Vehicles in Household Correlation Summary
| Measurement | Liberian | Immigrants |
| Minimum | 66.4% | 55.0% |
| Maximum | 100.0% | 100.0% |
| Range | 33.6% | 45.0% |
| Mean | 89.3% | 88.7% |
| Median | 91.2% | 90.6% |
| Interquartile 25% (IQ1) | 85.6% | 87.0% |
| Interquartile 75% (IQ3) | 95.4% | 93.2% |
| Interquartile Range (IQR) | 9.8% | 6.2% |
| Standard Deviation (Sample) | 7.7% | 8.1% |
| Standard Deviation (Population) | 7.7% | 8.1% |
Similar Demographics by 1 or more Vehicles in Household
Demographics Similar to Liberians by 1 or more Vehicles in Household
In terms of 1 or more vehicles in household, the demographic groups most similar to Liberians are Colombian (88.0%, a difference of 0.0%), South American Indian (88.0%, a difference of 0.0%), Immigrants from Latvia (88.1%, a difference of 0.010%), Haitian (88.1%, a difference of 0.030%), and Nigerian (88.0%, a difference of 0.030%).
| Demographics | Rating | Rank | 1 or more Vehicles in Household |
| Egyptians | 1.2 /100 | #250 | Tragic 88.2% |
| Immigrants | Serbia | 1.2 /100 | #251 | Tragic 88.2% |
| Immigrants | Uruguay | 1.1 /100 | #252 | Tragic 88.1% |
| Hondurans | 1.0 /100 | #253 | Tragic 88.1% |
| Haitians | 0.9 /100 | #254 | Tragic 88.1% |
| Immigrants | Latvia | 0.9 /100 | #255 | Tragic 88.1% |
| Colombians | 0.9 /100 | #256 | Tragic 88.0% |
| Liberians | 0.9 /100 | #257 | Tragic 88.0% |
| South American Indians | 0.9 /100 | #258 | Tragic 88.0% |
| Nigerians | 0.8 /100 | #259 | Tragic 88.0% |
| Macedonians | 0.6 /100 | #260 | Tragic 87.9% |
| Immigrants | Switzerland | 0.6 /100 | #261 | Tragic 87.9% |
| Sub-Saharan Africans | 0.5 /100 | #262 | Tragic 87.9% |
| Immigrants | Egypt | 0.5 /100 | #263 | Tragic 87.8% |
| Immigrants | Liberia | 0.4 /100 | #264 | Tragic 87.8% |
Demographics Similar to Immigrants by 1 or more Vehicles in Household
In terms of 1 or more vehicles in household, the demographic groups most similar to Immigrants are New Zealander (90.1%, a difference of 0.0%), Immigrants from Uganda (90.1%, a difference of 0.0%), Tlingit-Haida (90.1%, a difference of 0.010%), Australian (90.0%, a difference of 0.020%), and Immigrants from Bosnia and Herzegovina (90.1%, a difference of 0.040%).
| Demographics | Rating | Rank | 1 or more Vehicles in Household |
| Immigrants | Eastern Africa | 78.2 /100 | #148 | Good 90.1% |
| Immigrants | Nicaragua | 76.7 /100 | #149 | Good 90.1% |
| Immigrants | Micronesia | 75.9 /100 | #150 | Good 90.1% |
| Immigrants | Bosnia and Herzegovina | 75.4 /100 | #151 | Good 90.1% |
| Tlingit-Haida | 74.3 /100 | #152 | Good 90.1% |
| New Zealanders | 73.8 /100 | #153 | Good 90.1% |
| Immigrants | Uganda | 73.8 /100 | #154 | Good 90.1% |
| Immigrants | Immigrants | 73.6 /100 | #155 | Good 90.1% |
| Australians | 72.4 /100 | #156 | Good 90.0% |
| Immigrants | Congo | 71.2 /100 | #157 | Good 90.0% |
| Brazilians | 71.0 /100 | #158 | Good 90.0% |
| South Africans | 69.7 /100 | #159 | Good 90.0% |
| Immigrants | Indonesia | 68.8 /100 | #160 | Good 90.0% |
| Salvadorans | 68.7 /100 | #161 | Good 90.0% |
| Spanish American Indians | 67.0 /100 | #162 | Good 89.9% |