Liberian vs Immigrants Unemployment Among Seniors over 65 years
COMPARE
Liberian
Immigrants
Unemployment Among Seniors over 65 years
Unemployment Among Seniors over 65 years Comparison
Liberians
Immigrants
5.6%
UNEMPLOYMENT AMONG SENIORS OVER 65 YEARS
0.0/ 100
METRIC RATING
304th/ 347
METRIC RANK
5.4%
UNEMPLOYMENT AMONG SENIORS OVER 65 YEARS
0.6/ 100
METRIC RATING
249th/ 347
METRIC RANK
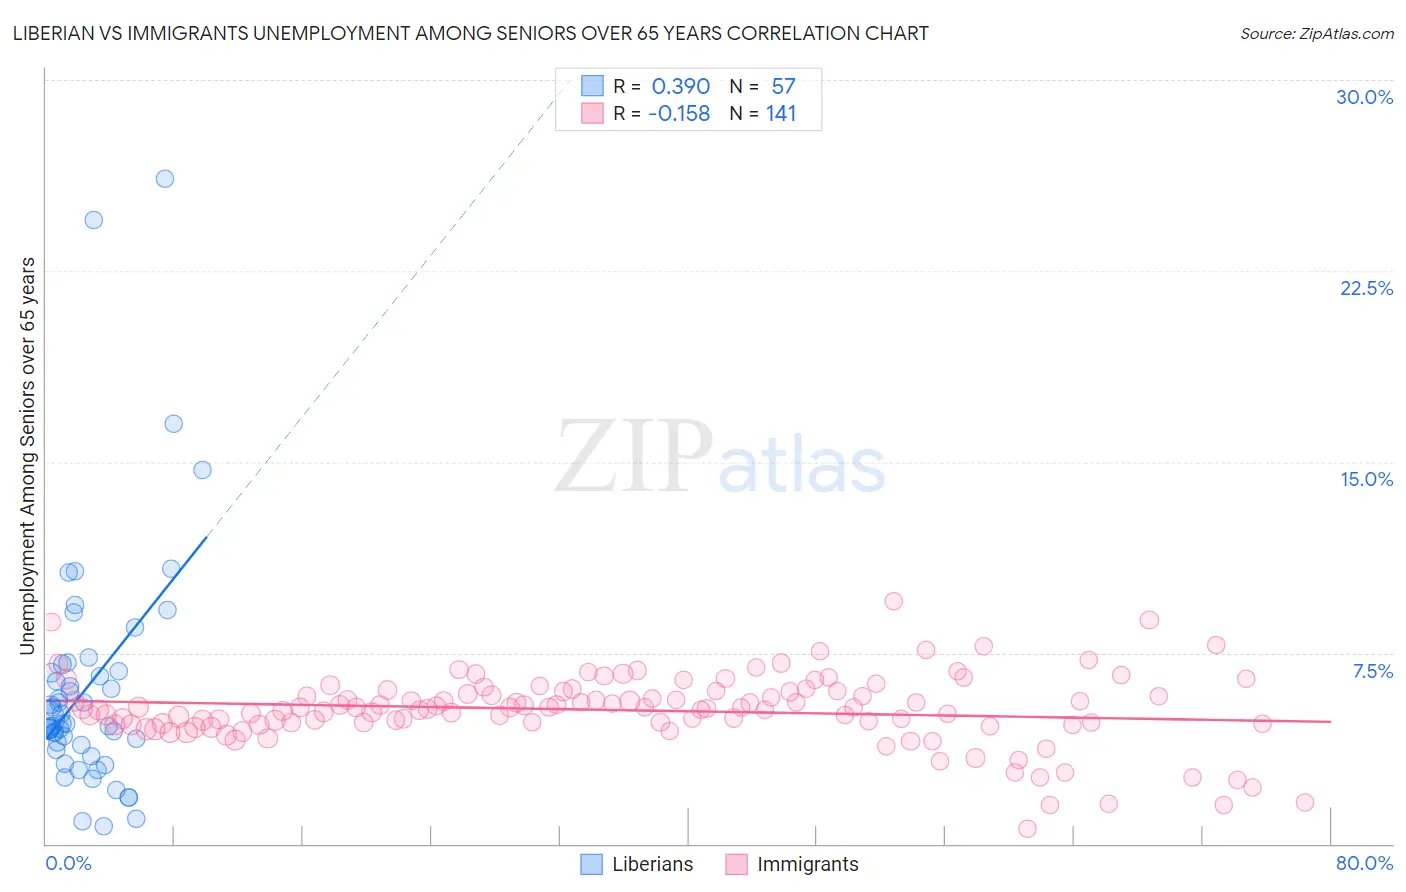
Liberian vs Immigrants Unemployment Among Seniors over 65 years Correlation Chart
The statistical analysis conducted on geographies consisting of 113,645,931 people shows a mild positive correlation between the proportion of Liberians and unemployment rate amomg seniors over the age of 65 in the United States with a correlation coefficient (R) of 0.390 and weighted average of 5.6%. Similarly, the statistical analysis conducted on geographies consisting of 464,359,515 people shows a poor negative correlation between the proportion of Immigrants and unemployment rate amomg seniors over the age of 65 in the United States with a correlation coefficient (R) of -0.158 and weighted average of 5.4%, a difference of 4.4%.
Unemployment Among Seniors over 65 years Correlation Summary
| Measurement | Liberian | Immigrants |
| Minimum | 0.70% | 0.60% |
| Maximum | 26.1% | 9.5% |
| Range | 25.4% | 8.9% |
| Mean | 6.2% | 5.3% |
| Median | 4.7% | 5.3% |
| Interquartile 25% (IQ1) | 3.8% | 4.7% |
| Interquartile 75% (IQ3) | 6.9% | 6.0% |
| Interquartile Range (IQR) | 3.1% | 1.3% |
| Standard Deviation (Sample) | 4.8% | 1.4% |
| Standard Deviation (Population) | 4.7% | 1.4% |
Similar Demographics by Unemployment Among Seniors over 65 years
Demographics Similar to Liberians by Unemployment Among Seniors over 65 years
In terms of unemployment among seniors over 65 years, the demographic groups most similar to Liberians are Immigrants from Latin America (5.6%, a difference of 0.070%), Mexican (5.6%, a difference of 0.16%), Guatemalan (5.6%, a difference of 0.17%), Ecuadorian (5.6%, a difference of 0.21%), and Portuguese (5.6%, a difference of 0.25%).
| Demographics | Rating | Rank | Unemployment Among Seniors over 65 years |
| Yaqui | 0.0 /100 | #297 | Tragic 5.5% |
| Immigrants | West Indies | 0.0 /100 | #298 | Tragic 5.6% |
| Guyanese | 0.0 /100 | #299 | Tragic 5.6% |
| Zimbabweans | 0.0 /100 | #300 | Tragic 5.6% |
| Hispanics or Latinos | 0.0 /100 | #301 | Tragic 5.6% |
| Guatemalans | 0.0 /100 | #302 | Tragic 5.6% |
| Immigrants | Latin America | 0.0 /100 | #303 | Tragic 5.6% |
| Liberians | 0.0 /100 | #304 | Tragic 5.6% |
| Mexicans | 0.0 /100 | #305 | Tragic 5.6% |
| Ecuadorians | 0.0 /100 | #306 | Tragic 5.6% |
| Portuguese | 0.0 /100 | #307 | Tragic 5.6% |
| Immigrants | St. Vincent and the Grenadines | 0.0 /100 | #308 | Tragic 5.6% |
| Immigrants | Guatemala | 0.0 /100 | #309 | Tragic 5.6% |
| Salvadorans | 0.0 /100 | #310 | Tragic 5.6% |
| Immigrants | Guyana | 0.0 /100 | #311 | Tragic 5.6% |
Demographics Similar to Immigrants by Unemployment Among Seniors over 65 years
In terms of unemployment among seniors over 65 years, the demographic groups most similar to Immigrants are Ghanaian (5.4%, a difference of 0.0%), West Indian (5.4%, a difference of 0.010%), French Canadian (5.4%, a difference of 0.020%), Immigrants from Caribbean (5.3%, a difference of 0.080%), and Trinidadian and Tobagonian (5.4%, a difference of 0.080%).
| Demographics | Rating | Rank | Unemployment Among Seniors over 65 years |
| Bahamians | 0.9 /100 | #242 | Tragic 5.3% |
| Nigerians | 0.9 /100 | #243 | Tragic 5.3% |
| Peruvians | 0.8 /100 | #244 | Tragic 5.3% |
| Ottawa | 0.8 /100 | #245 | Tragic 5.3% |
| Colombians | 0.7 /100 | #246 | Tragic 5.3% |
| Immigrants | Caribbean | 0.7 /100 | #247 | Tragic 5.3% |
| French Canadians | 0.7 /100 | #248 | Tragic 5.4% |
| Immigrants | Immigrants | 0.6 /100 | #249 | Tragic 5.4% |
| Ghanaians | 0.6 /100 | #250 | Tragic 5.4% |
| West Indians | 0.6 /100 | #251 | Tragic 5.4% |
| Trinidadians and Tobagonians | 0.6 /100 | #252 | Tragic 5.4% |
| Immigrants | Sierra Leone | 0.6 /100 | #253 | Tragic 5.4% |
| Paraguayans | 0.5 /100 | #254 | Tragic 5.4% |
| Immigrants | Peru | 0.5 /100 | #255 | Tragic 5.4% |
| Moroccans | 0.5 /100 | #256 | Tragic 5.4% |