Potawatomi vs Immigrants 1 or more Vehicles in Household
COMPARE
Potawatomi
Immigrants
1 or more Vehicles in Household
1 or more Vehicles in Household Comparison
Potawatomi
Immigrants
91.3%
1 OR MORE VEHICLES IN HOUSEHOLD
99.0/ 100
METRIC RATING
96th/ 347
METRIC RANK
90.1%
1 OR MORE VEHICLES IN HOUSEHOLD
73.6/ 100
METRIC RATING
155th/ 347
METRIC RANK
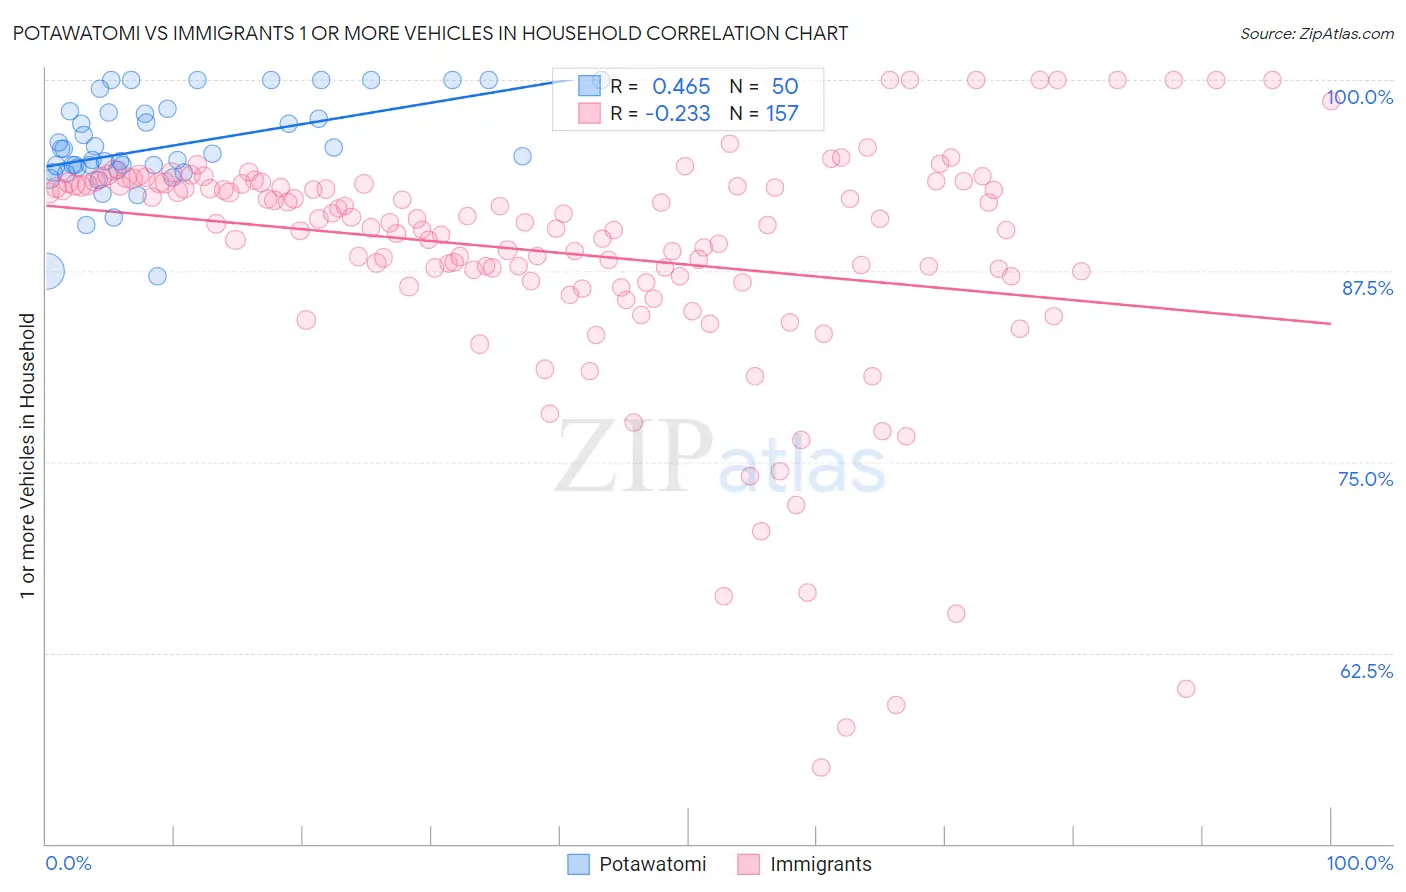
Potawatomi vs Immigrants 1 or more Vehicles in Household Correlation Chart
The statistical analysis conducted on geographies consisting of 117,763,278 people shows a moderate positive correlation between the proportion of Potawatomi and percentage of households with 1 or more vehicles available in the United States with a correlation coefficient (R) of 0.465 and weighted average of 91.3%. Similarly, the statistical analysis conducted on geographies consisting of 566,737,688 people shows a weak negative correlation between the proportion of Immigrants and percentage of households with 1 or more vehicles available in the United States with a correlation coefficient (R) of -0.233 and weighted average of 90.1%, a difference of 1.4%.
1 or more Vehicles in Household Correlation Summary
| Measurement | Potawatomi | Immigrants |
| Minimum | 87.1% | 55.0% |
| Maximum | 100.0% | 100.0% |
| Range | 12.9% | 45.0% |
| Mean | 95.6% | 88.7% |
| Median | 95.1% | 90.6% |
| Interquartile 25% (IQ1) | 94.1% | 87.0% |
| Interquartile 75% (IQ3) | 97.9% | 93.2% |
| Interquartile Range (IQR) | 3.8% | 6.2% |
| Standard Deviation (Sample) | 3.1% | 8.1% |
| Standard Deviation (Population) | 3.0% | 8.1% |
Similar Demographics by 1 or more Vehicles in Household
Demographics Similar to Potawatomi by 1 or more Vehicles in Household
In terms of 1 or more vehicles in household, the demographic groups most similar to Potawatomi are Austrian (91.3%, a difference of 0.010%), Pakistani (91.3%, a difference of 0.010%), Immigrants from Cuba (91.3%, a difference of 0.020%), Bhutanese (91.4%, a difference of 0.080%), and Immigrants from North America (91.4%, a difference of 0.080%).
| Demographics | Rating | Rank | 1 or more Vehicles in Household |
| Bangladeshis | 99.2 /100 | #89 | Exceptional 91.4% |
| Immigrants | Canada | 99.2 /100 | #90 | Exceptional 91.4% |
| Immigrants | Jordan | 99.2 /100 | #91 | Exceptional 91.4% |
| Bhutanese | 99.2 /100 | #92 | Exceptional 91.4% |
| Immigrants | North America | 99.2 /100 | #93 | Exceptional 91.4% |
| Immigrants | Cuba | 99.1 /100 | #94 | Exceptional 91.3% |
| Austrians | 99.0 /100 | #95 | Exceptional 91.3% |
| Potawatomi | 99.0 /100 | #96 | Exceptional 91.3% |
| Pakistanis | 99.0 /100 | #97 | Exceptional 91.3% |
| Slavs | 98.7 /100 | #98 | Exceptional 91.2% |
| Immigrants | Bolivia | 98.6 /100 | #99 | Exceptional 91.2% |
| Immigrants | Central America | 98.4 /100 | #100 | Exceptional 91.1% |
| Bulgarians | 98.4 /100 | #101 | Exceptional 91.1% |
| Seminole | 98.3 /100 | #102 | Exceptional 91.1% |
| Yugoslavians | 98.3 /100 | #103 | Exceptional 91.1% |
Demographics Similar to Immigrants by 1 or more Vehicles in Household
In terms of 1 or more vehicles in household, the demographic groups most similar to Immigrants are New Zealander (90.1%, a difference of 0.0%), Immigrants from Uganda (90.1%, a difference of 0.0%), Tlingit-Haida (90.1%, a difference of 0.010%), Australian (90.0%, a difference of 0.020%), and Immigrants from Bosnia and Herzegovina (90.1%, a difference of 0.040%).
| Demographics | Rating | Rank | 1 or more Vehicles in Household |
| Immigrants | Eastern Africa | 78.2 /100 | #148 | Good 90.1% |
| Immigrants | Nicaragua | 76.7 /100 | #149 | Good 90.1% |
| Immigrants | Micronesia | 75.9 /100 | #150 | Good 90.1% |
| Immigrants | Bosnia and Herzegovina | 75.4 /100 | #151 | Good 90.1% |
| Tlingit-Haida | 74.3 /100 | #152 | Good 90.1% |
| New Zealanders | 73.8 /100 | #153 | Good 90.1% |
| Immigrants | Uganda | 73.8 /100 | #154 | Good 90.1% |
| Immigrants | Immigrants | 73.6 /100 | #155 | Good 90.1% |
| Australians | 72.4 /100 | #156 | Good 90.0% |
| Immigrants | Congo | 71.2 /100 | #157 | Good 90.0% |
| Brazilians | 71.0 /100 | #158 | Good 90.0% |
| South Africans | 69.7 /100 | #159 | Good 90.0% |
| Immigrants | Indonesia | 68.8 /100 | #160 | Good 90.0% |
| Salvadorans | 68.7 /100 | #161 | Good 90.0% |
| Spanish American Indians | 67.0 /100 | #162 | Good 89.9% |