Immigrants from Armenia vs Immigrants 1 or more Vehicles in Household
COMPARE
Immigrants from Armenia
Immigrants
1 or more Vehicles in Household
1 or more Vehicles in Household Comparison
Immigrants from Armenia
Immigrants
89.4%
1 OR MORE VEHICLES IN HOUSEHOLD
31.8/ 100
METRIC RATING
195th/ 347
METRIC RANK
90.1%
1 OR MORE VEHICLES IN HOUSEHOLD
73.6/ 100
METRIC RATING
155th/ 347
METRIC RANK
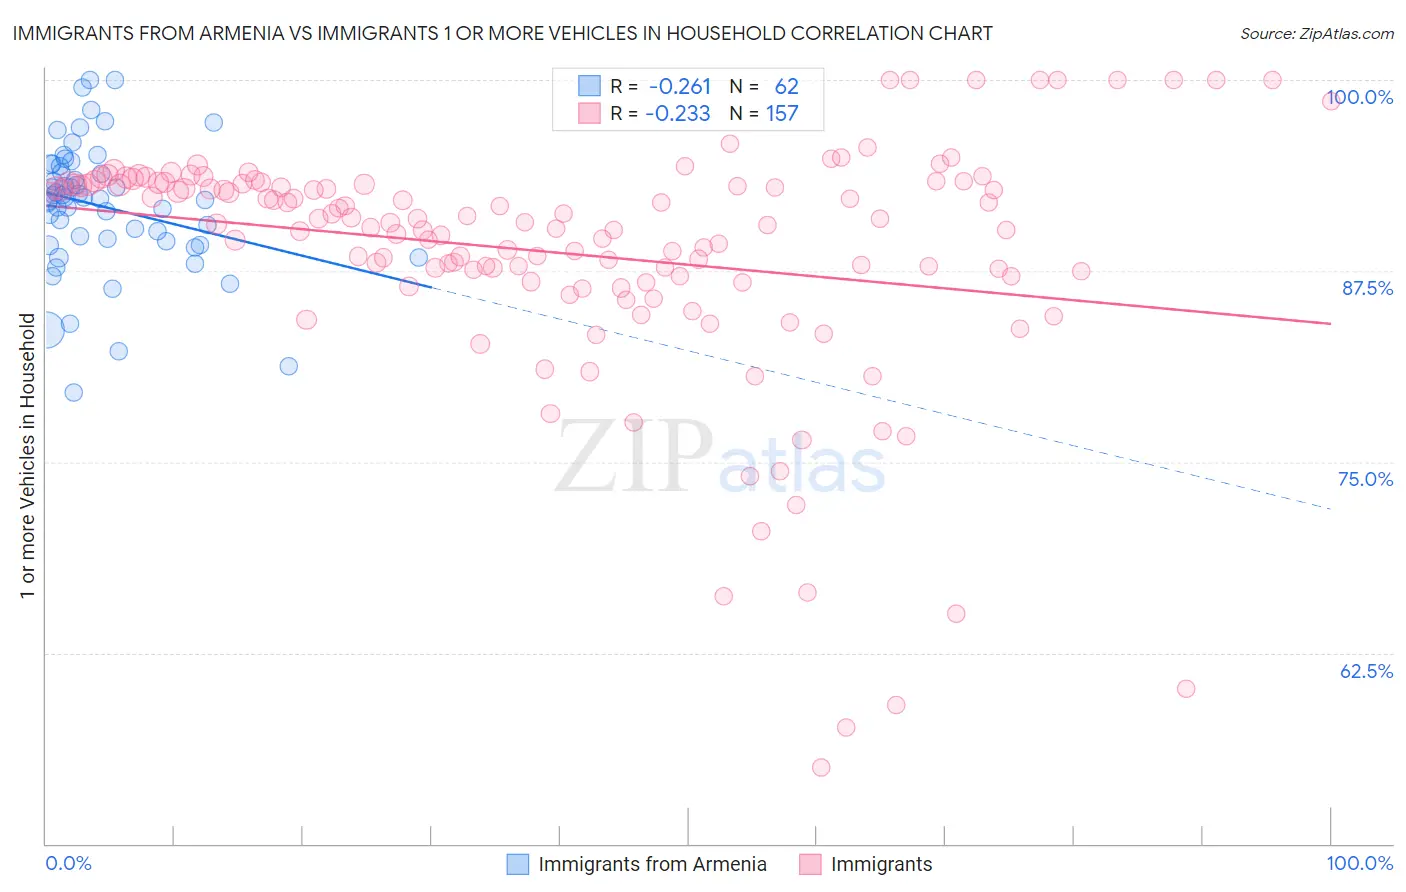
Immigrants from Armenia vs Immigrants 1 or more Vehicles in Household Correlation Chart
The statistical analysis conducted on geographies consisting of 97,564,455 people shows a weak negative correlation between the proportion of Immigrants from Armenia and percentage of households with 1 or more vehicles available in the United States with a correlation coefficient (R) of -0.261 and weighted average of 89.4%. Similarly, the statistical analysis conducted on geographies consisting of 566,737,688 people shows a weak negative correlation between the proportion of Immigrants and percentage of households with 1 or more vehicles available in the United States with a correlation coefficient (R) of -0.233 and weighted average of 90.1%, a difference of 0.70%.
1 or more Vehicles in Household Correlation Summary
| Measurement | Immigrants from Armenia | Immigrants |
| Minimum | 79.5% | 55.0% |
| Maximum | 100.0% | 100.0% |
| Range | 20.5% | 45.0% |
| Mean | 91.7% | 88.7% |
| Median | 92.3% | 90.6% |
| Interquartile 25% (IQ1) | 89.4% | 87.0% |
| Interquartile 75% (IQ3) | 94.4% | 93.2% |
| Interquartile Range (IQR) | 5.0% | 6.2% |
| Standard Deviation (Sample) | 4.2% | 8.1% |
| Standard Deviation (Population) | 4.2% | 8.1% |
Similar Demographics by 1 or more Vehicles in Household
Demographics Similar to Immigrants from Armenia by 1 or more Vehicles in Household
In terms of 1 or more vehicles in household, the demographic groups most similar to Immigrants from Armenia are Immigrants from Eritrea (89.4%, a difference of 0.020%), Immigrants from Northern Europe (89.5%, a difference of 0.060%), Immigrants from North Macedonia (89.5%, a difference of 0.080%), Immigrants from Poland (89.5%, a difference of 0.090%), and Carpatho Rusyn (89.5%, a difference of 0.10%).
| Demographics | Rating | Rank | 1 or more Vehicles in Household |
| Immigrants | Nepal | 38.9 /100 | #188 | Fair 89.5% |
| Carpatho Rusyns | 37.8 /100 | #189 | Fair 89.5% |
| Shoshone | 37.5 /100 | #190 | Fair 89.5% |
| Immigrants | Poland | 37.1 /100 | #191 | Fair 89.5% |
| Immigrants | North Macedonia | 36.5 /100 | #192 | Fair 89.5% |
| Immigrants | Northern Europe | 35.5 /100 | #193 | Fair 89.5% |
| Immigrants | Eritrea | 33.2 /100 | #194 | Fair 89.4% |
| Immigrants | Armenia | 31.8 /100 | #195 | Fair 89.4% |
| Crow | 24.3 /100 | #196 | Fair 89.3% |
| Immigrants | Sweden | 23.6 /100 | #197 | Fair 89.3% |
| Pennsylvania Germans | 22.9 /100 | #198 | Fair 89.3% |
| Immigrants | Asia | 22.8 /100 | #199 | Fair 89.3% |
| Central Americans | 21.4 /100 | #200 | Fair 89.2% |
| Immigrants | Western Europe | 20.5 /100 | #201 | Fair 89.2% |
| Iroquois | 19.8 /100 | #202 | Poor 89.2% |
Demographics Similar to Immigrants by 1 or more Vehicles in Household
In terms of 1 or more vehicles in household, the demographic groups most similar to Immigrants are New Zealander (90.1%, a difference of 0.0%), Immigrants from Uganda (90.1%, a difference of 0.0%), Tlingit-Haida (90.1%, a difference of 0.010%), Australian (90.0%, a difference of 0.020%), and Immigrants from Bosnia and Herzegovina (90.1%, a difference of 0.040%).
| Demographics | Rating | Rank | 1 or more Vehicles in Household |
| Immigrants | Eastern Africa | 78.2 /100 | #148 | Good 90.1% |
| Immigrants | Nicaragua | 76.7 /100 | #149 | Good 90.1% |
| Immigrants | Micronesia | 75.9 /100 | #150 | Good 90.1% |
| Immigrants | Bosnia and Herzegovina | 75.4 /100 | #151 | Good 90.1% |
| Tlingit-Haida | 74.3 /100 | #152 | Good 90.1% |
| New Zealanders | 73.8 /100 | #153 | Good 90.1% |
| Immigrants | Uganda | 73.8 /100 | #154 | Good 90.1% |
| Immigrants | Immigrants | 73.6 /100 | #155 | Good 90.1% |
| Australians | 72.4 /100 | #156 | Good 90.0% |
| Immigrants | Congo | 71.2 /100 | #157 | Good 90.0% |
| Brazilians | 71.0 /100 | #158 | Good 90.0% |
| South Africans | 69.7 /100 | #159 | Good 90.0% |
| Immigrants | Indonesia | 68.8 /100 | #160 | Good 90.0% |
| Salvadorans | 68.7 /100 | #161 | Good 90.0% |
| Spanish American Indians | 67.0 /100 | #162 | Good 89.9% |