Kenyan vs Colombian 4 or more Vehicles in Household
COMPARE
Kenyan
Colombian
4 or more Vehicles in Household
4 or more Vehicles in Household Comparison
Kenyans
Colombians
6.1%
4 OR MORE VEHICLES IN HOUSEHOLD
18.5/ 100
METRIC RATING
206th/ 347
METRIC RANK
5.5%
4 OR MORE VEHICLES IN HOUSEHOLD
0.7/ 100
METRIC RATING
268th/ 347
METRIC RANK
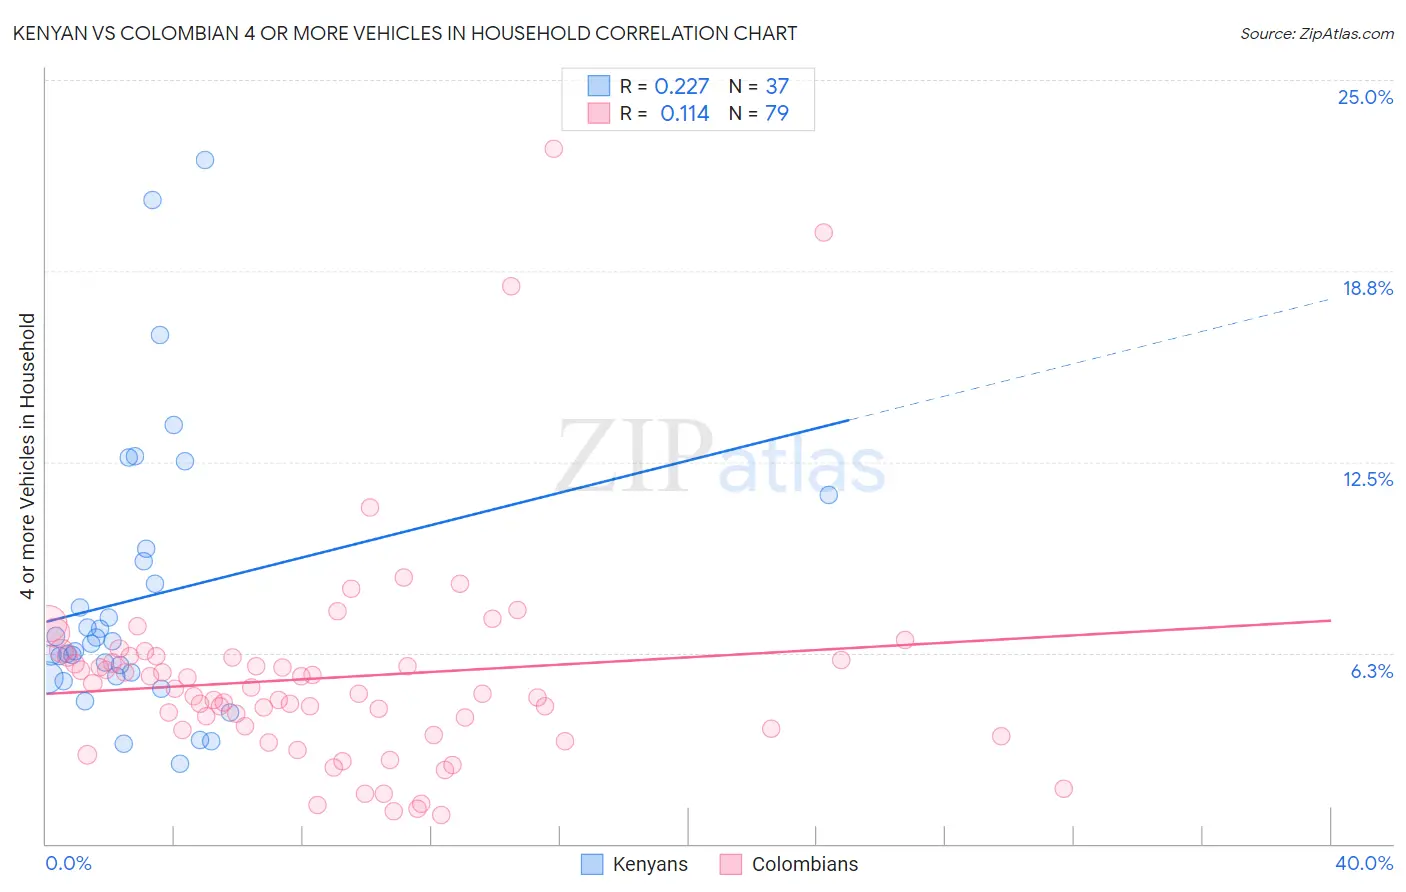
Kenyan vs Colombian 4 or more Vehicles in Household Correlation Chart
The statistical analysis conducted on geographies consisting of 167,746,674 people shows a weak positive correlation between the proportion of Kenyans and percentage of households with 4 or more vehicles available in the United States with a correlation coefficient (R) of 0.227 and weighted average of 6.1%. Similarly, the statistical analysis conducted on geographies consisting of 417,475,728 people shows a poor positive correlation between the proportion of Colombians and percentage of households with 4 or more vehicles available in the United States with a correlation coefficient (R) of 0.114 and weighted average of 5.5%, a difference of 9.9%.
4 or more Vehicles in Household Correlation Summary
| Measurement | Kenyan | Colombian |
| Minimum | 2.6% | 0.92% |
| Maximum | 22.4% | 22.8% |
| Range | 19.8% | 21.8% |
| Mean | 8.1% | 5.4% |
| Median | 6.5% | 4.9% |
| Interquartile 25% (IQ1) | 5.5% | 3.7% |
| Interquartile 75% (IQ3) | 9.5% | 6.1% |
| Interquartile Range (IQR) | 4.0% | 2.4% |
| Standard Deviation (Sample) | 4.6% | 3.6% |
| Standard Deviation (Population) | 4.5% | 3.5% |
Similar Demographics by 4 or more Vehicles in Household
Demographics Similar to Kenyans by 4 or more Vehicles in Household
In terms of 4 or more vehicles in household, the demographic groups most similar to Kenyans are Honduran (6.1%, a difference of 0.14%), Immigrants from Belize (6.1%, a difference of 0.23%), Immigrants from Chile (6.1%, a difference of 0.28%), Immigrants from Sierra Leone (6.1%, a difference of 0.33%), and Immigrants from South Central Asia (6.1%, a difference of 0.47%).
| Demographics | Rating | Rank | 4 or more Vehicles in Household |
| Immigrants | Norway | 21.8 /100 | #199 | Fair 6.1% |
| Latvians | 21.7 /100 | #200 | Fair 6.1% |
| Egyptians | 21.4 /100 | #201 | Fair 6.1% |
| Immigrants | South Central Asia | 21.3 /100 | #202 | Fair 6.1% |
| Immigrants | Sierra Leone | 20.5 /100 | #203 | Fair 6.1% |
| Immigrants | Belize | 19.8 /100 | #204 | Poor 6.1% |
| Hondurans | 19.3 /100 | #205 | Poor 6.1% |
| Kenyans | 18.5 /100 | #206 | Poor 6.1% |
| Immigrants | Chile | 16.9 /100 | #207 | Poor 6.1% |
| Immigrants | Nigeria | 15.6 /100 | #208 | Poor 6.1% |
| Immigrants | Honduras | 15.4 /100 | #209 | Poor 6.1% |
| Immigrants | Zimbabwe | 15.1 /100 | #210 | Poor 6.0% |
| Panamanians | 14.8 /100 | #211 | Poor 6.0% |
| Immigrants | Egypt | 14.7 /100 | #212 | Poor 6.0% |
| Arabs | 14.4 /100 | #213 | Poor 6.0% |
Demographics Similar to Colombians by 4 or more Vehicles in Household
In terms of 4 or more vehicles in household, the demographic groups most similar to Colombians are Carpatho Rusyn (5.5%, a difference of 0.16%), Okinawan (5.5%, a difference of 0.36%), Immigrants from Ukraine (5.6%, a difference of 0.43%), Immigrants from Sudan (5.5%, a difference of 0.46%), and Immigrants from Nepal (5.6%, a difference of 0.51%).
| Demographics | Rating | Rank | 4 or more Vehicles in Household |
| Sudanese | 1.2 /100 | #261 | Tragic 5.6% |
| Bermudans | 1.2 /100 | #262 | Tragic 5.6% |
| Immigrants | Saudi Arabia | 1.1 /100 | #263 | Tragic 5.6% |
| Immigrants | Africa | 1.0 /100 | #264 | Tragic 5.6% |
| South Americans | 0.9 /100 | #265 | Tragic 5.6% |
| Immigrants | Nepal | 0.9 /100 | #266 | Tragic 5.6% |
| Immigrants | Ukraine | 0.9 /100 | #267 | Tragic 5.6% |
| Colombians | 0.7 /100 | #268 | Tragic 5.5% |
| Carpatho Rusyns | 0.7 /100 | #269 | Tragic 5.5% |
| Okinawans | 0.6 /100 | #270 | Tragic 5.5% |
| Immigrants | Sudan | 0.6 /100 | #271 | Tragic 5.5% |
| Immigrants | Kazakhstan | 0.6 /100 | #272 | Tragic 5.5% |
| Macedonians | 0.6 /100 | #273 | Tragic 5.5% |
| Blacks/African Americans | 0.6 /100 | #274 | Tragic 5.5% |
| Cambodians | 0.5 /100 | #275 | Tragic 5.5% |