Dutch vs Guatemalan 1 or more Vehicles in Household
COMPARE
Dutch
Guatemalan
1 or more Vehicles in Household
1 or more Vehicles in Household Comparison
Dutch
Guatemalans
93.3%
1 OR MORE VEHICLES IN HOUSEHOLD
100.0/ 100
METRIC RATING
10th/ 347
METRIC RANK
89.2%
1 OR MORE VEHICLES IN HOUSEHOLD
17.8/ 100
METRIC RATING
205th/ 347
METRIC RANK
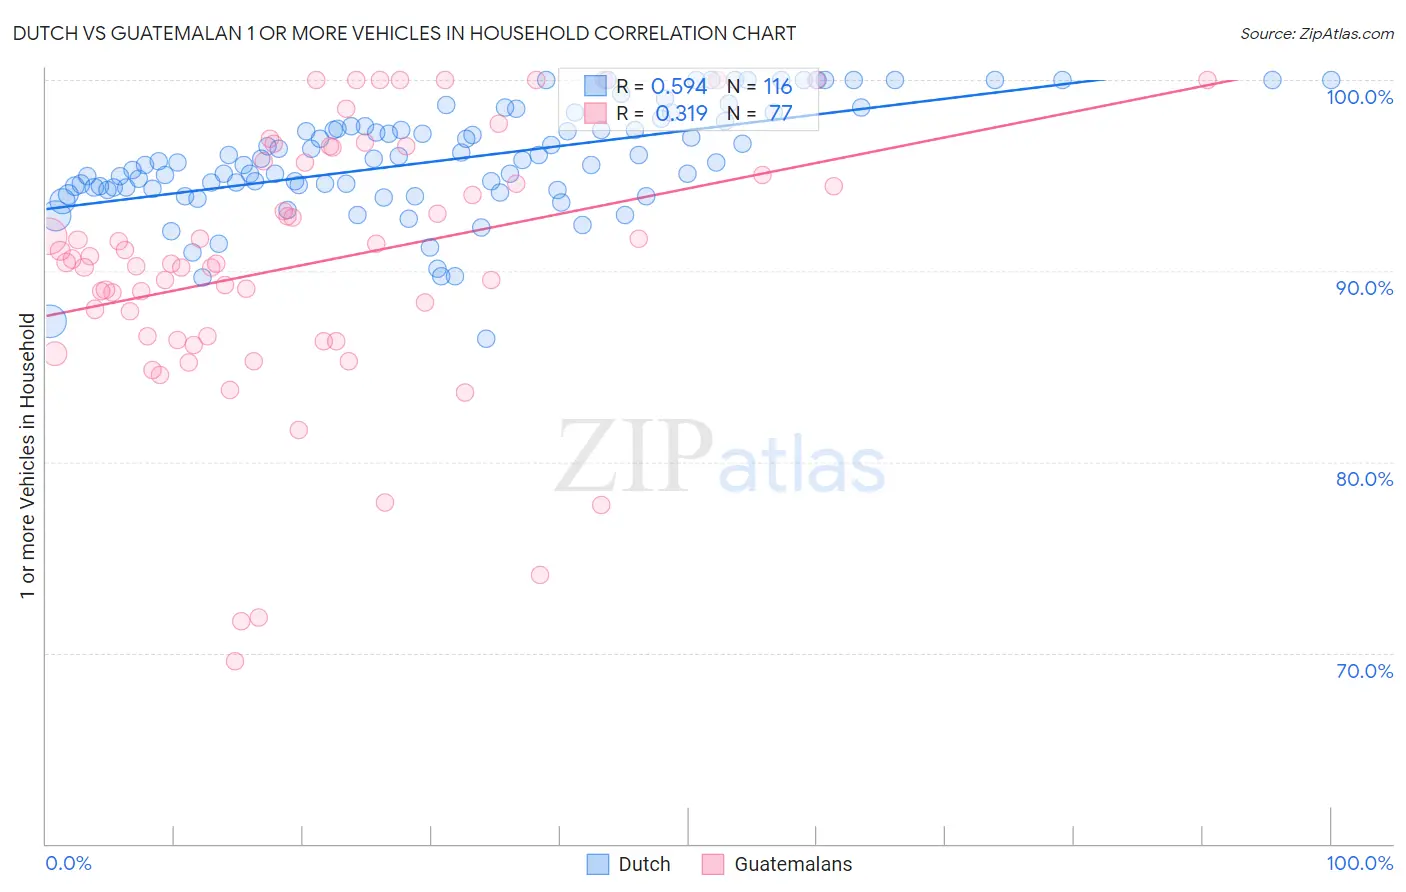
Dutch vs Guatemalan 1 or more Vehicles in Household Correlation Chart
The statistical analysis conducted on geographies consisting of 553,951,322 people shows a substantial positive correlation between the proportion of Dutch and percentage of households with 1 or more vehicles available in the United States with a correlation coefficient (R) of 0.594 and weighted average of 93.3%. Similarly, the statistical analysis conducted on geographies consisting of 409,296,484 people shows a mild positive correlation between the proportion of Guatemalans and percentage of households with 1 or more vehicles available in the United States with a correlation coefficient (R) of 0.319 and weighted average of 89.2%, a difference of 4.6%.
1 or more Vehicles in Household Correlation Summary
| Measurement | Dutch | Guatemalan |
| Minimum | 86.4% | 69.6% |
| Maximum | 100.0% | 100.0% |
| Range | 13.6% | 30.4% |
| Mean | 95.8% | 90.4% |
| Median | 95.7% | 90.4% |
| Interquartile 25% (IQ1) | 94.3% | 86.5% |
| Interquartile 75% (IQ3) | 97.6% | 95.7% |
| Interquartile Range (IQR) | 3.2% | 9.3% |
| Standard Deviation (Sample) | 2.8% | 6.9% |
| Standard Deviation (Population) | 2.8% | 6.8% |
Similar Demographics by 1 or more Vehicles in Household
Demographics Similar to Dutch by 1 or more Vehicles in Household
In terms of 1 or more vehicles in household, the demographic groups most similar to Dutch are Scotch-Irish (93.3%, a difference of 0.030%), Czech (93.3%, a difference of 0.030%), Swedish (93.3%, a difference of 0.040%), Scottish (93.4%, a difference of 0.080%), and Scandinavian (93.1%, a difference of 0.19%).
| Demographics | Rating | Rank | 1 or more Vehicles in Household |
| Norwegians | 100.0 /100 | #3 | Exceptional 93.7% |
| Germans | 100.0 /100 | #4 | Exceptional 93.6% |
| Yakama | 100.0 /100 | #5 | Exceptional 93.6% |
| Danes | 100.0 /100 | #6 | Exceptional 93.5% |
| Scottish | 100.0 /100 | #7 | Exceptional 93.4% |
| Swedes | 100.0 /100 | #8 | Exceptional 93.3% |
| Scotch-Irish | 100.0 /100 | #9 | Exceptional 93.3% |
| Dutch | 100.0 /100 | #10 | Exceptional 93.3% |
| Czechs | 100.0 /100 | #11 | Exceptional 93.3% |
| Scandinavians | 100.0 /100 | #12 | Exceptional 93.1% |
| Whites/Caucasians | 100.0 /100 | #13 | Exceptional 93.1% |
| Irish | 100.0 /100 | #14 | Exceptional 93.1% |
| Mexicans | 100.0 /100 | #15 | Exceptional 93.0% |
| Assyrians/Chaldeans/Syriacs | 100.0 /100 | #16 | Exceptional 93.0% |
| Europeans | 100.0 /100 | #17 | Exceptional 93.0% |
Demographics Similar to Guatemalans by 1 or more Vehicles in Household
In terms of 1 or more vehicles in household, the demographic groups most similar to Guatemalans are Romanian (89.2%, a difference of 0.010%), Cambodian (89.2%, a difference of 0.030%), Iroquois (89.2%, a difference of 0.050%), Apache (89.1%, a difference of 0.050%), and Immigrants from Western Europe (89.2%, a difference of 0.070%).
| Demographics | Rating | Rank | 1 or more Vehicles in Household |
| Pennsylvania Germans | 22.9 /100 | #198 | Fair 89.3% |
| Immigrants | Asia | 22.8 /100 | #199 | Fair 89.3% |
| Central Americans | 21.4 /100 | #200 | Fair 89.2% |
| Immigrants | Western Europe | 20.5 /100 | #201 | Fair 89.2% |
| Iroquois | 19.8 /100 | #202 | Poor 89.2% |
| Cambodians | 18.9 /100 | #203 | Poor 89.2% |
| Romanians | 18.2 /100 | #204 | Poor 89.2% |
| Guatemalans | 17.8 /100 | #205 | Poor 89.2% |
| Apache | 16.2 /100 | #206 | Poor 89.1% |
| Immigrants | Denmark | 14.8 /100 | #207 | Poor 89.1% |
| Immigrants | Chile | 14.4 /100 | #208 | Poor 89.1% |
| Immigrants | Italy | 14.0 /100 | #209 | Poor 89.1% |
| Dutch West Indians | 13.5 /100 | #210 | Poor 89.0% |
| Sierra Leoneans | 13.0 /100 | #211 | Poor 89.0% |
| Somalis | 12.8 /100 | #212 | Poor 89.0% |