Immigrants from Austria vs Soviet Union 1 or more Vehicles in Household
COMPARE
Immigrants from Austria
Soviet Union
1 or more Vehicles in Household
1 or more Vehicles in Household Comparison
Immigrants from Austria
Soviet Union
89.9%
1 OR MORE VEHICLES IN HOUSEHOLD
65.5/ 100
METRIC RATING
163rd/ 347
METRIC RANK
82.7%
1 OR MORE VEHICLES IN HOUSEHOLD
0.0/ 100
METRIC RATING
320th/ 347
METRIC RANK
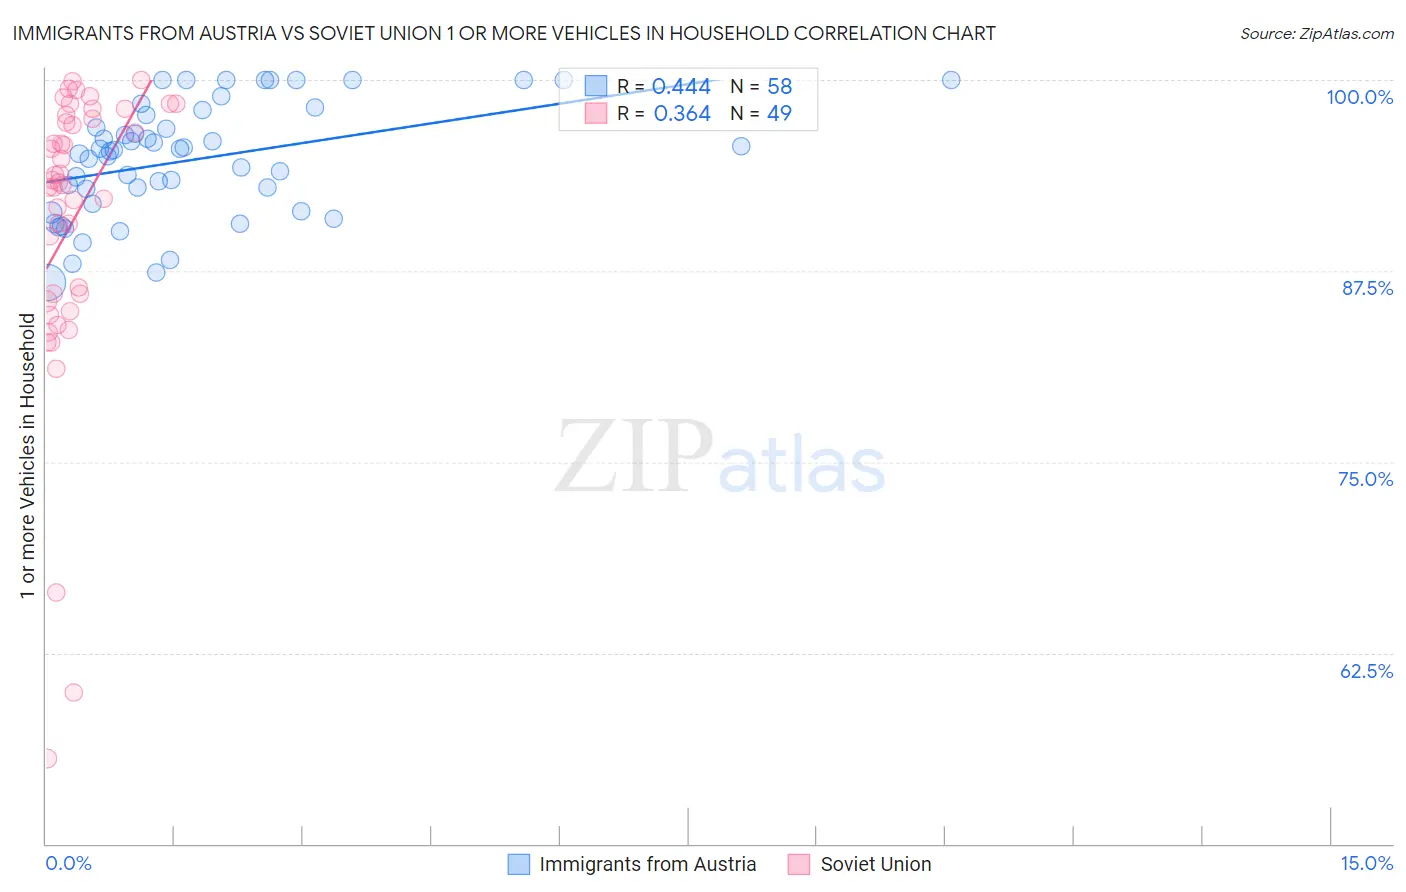
Immigrants from Austria vs Soviet Union 1 or more Vehicles in Household Correlation Chart
The statistical analysis conducted on geographies consisting of 167,940,062 people shows a moderate positive correlation between the proportion of Immigrants from Austria and percentage of households with 1 or more vehicles available in the United States with a correlation coefficient (R) of 0.444 and weighted average of 89.9%. Similarly, the statistical analysis conducted on geographies consisting of 43,492,822 people shows a mild positive correlation between the proportion of Soviet Union and percentage of households with 1 or more vehicles available in the United States with a correlation coefficient (R) of 0.364 and weighted average of 82.7%, a difference of 8.8%.
1 or more Vehicles in Household Correlation Summary
| Measurement | Immigrants from Austria | Soviet Union |
| Minimum | 86.7% | 55.6% |
| Maximum | 100.0% | 100.0% |
| Range | 13.3% | 44.4% |
| Mean | 94.8% | 90.7% |
| Median | 95.4% | 93.3% |
| Interquartile 25% (IQ1) | 91.9% | 85.7% |
| Interquartile 75% (IQ3) | 97.7% | 97.6% |
| Interquartile Range (IQR) | 5.8% | 11.8% |
| Standard Deviation (Sample) | 3.7% | 9.6% |
| Standard Deviation (Population) | 3.7% | 9.5% |
Similar Demographics by 1 or more Vehicles in Household
Demographics Similar to Immigrants from Austria by 1 or more Vehicles in Household
In terms of 1 or more vehicles in household, the demographic groups most similar to Immigrants from Austria are Spanish American Indian (89.9%, a difference of 0.030%), Comanche (89.9%, a difference of 0.040%), Immigrants from Saudi Arabia (89.9%, a difference of 0.050%), Immigrants from Indonesia (90.0%, a difference of 0.060%), and Salvadoran (90.0%, a difference of 0.060%).
| Demographics | Rating | Rank | 1 or more Vehicles in Household |
| Australians | 72.4 /100 | #156 | Good 90.0% |
| Immigrants | Congo | 71.2 /100 | #157 | Good 90.0% |
| Brazilians | 71.0 /100 | #158 | Good 90.0% |
| South Africans | 69.7 /100 | #159 | Good 90.0% |
| Immigrants | Indonesia | 68.8 /100 | #160 | Good 90.0% |
| Salvadorans | 68.7 /100 | #161 | Good 90.0% |
| Spanish American Indians | 67.0 /100 | #162 | Good 89.9% |
| Immigrants | Austria | 65.5 /100 | #163 | Good 89.9% |
| Comanche | 63.4 /100 | #164 | Good 89.9% |
| Immigrants | Saudi Arabia | 62.6 /100 | #165 | Good 89.9% |
| Immigrants | Middle Africa | 62.2 /100 | #166 | Good 89.9% |
| Immigrants | Latin America | 60.3 /100 | #167 | Good 89.8% |
| Immigrants | Cambodia | 60.1 /100 | #168 | Good 89.8% |
| Natives/Alaskans | 59.5 /100 | #169 | Average 89.8% |
| Immigrants | Costa Rica | 57.6 /100 | #170 | Average 89.8% |
Demographics Similar to Soviet Union by 1 or more Vehicles in Household
In terms of 1 or more vehicles in household, the demographic groups most similar to Soviet Union are Jamaican (82.1%, a difference of 0.64%), Immigrants from Belarus (83.3%, a difference of 0.81%), Immigrants from Ghana (83.4%, a difference of 0.94%), Ghanaian (83.6%, a difference of 1.1%), and Immigrants from Cabo Verde (81.6%, a difference of 1.3%).
| Demographics | Rating | Rank | 1 or more Vehicles in Household |
| Immigrants | Israel | 0.0 /100 | #313 | Tragic 84.5% |
| Albanians | 0.0 /100 | #314 | Tragic 84.4% |
| Cypriots | 0.0 /100 | #315 | Tragic 84.4% |
| Alaska Natives | 0.0 /100 | #316 | Tragic 83.8% |
| Ghanaians | 0.0 /100 | #317 | Tragic 83.6% |
| Immigrants | Ghana | 0.0 /100 | #318 | Tragic 83.4% |
| Immigrants | Belarus | 0.0 /100 | #319 | Tragic 83.3% |
| Soviet Union | 0.0 /100 | #320 | Tragic 82.7% |
| Jamaicans | 0.0 /100 | #321 | Tragic 82.1% |
| Immigrants | Cabo Verde | 0.0 /100 | #322 | Tragic 81.6% |
| Immigrants | Yemen | 0.0 /100 | #323 | Tragic 80.5% |
| Immigrants | Caribbean | 0.0 /100 | #324 | Tragic 80.4% |
| Senegalese | 0.0 /100 | #325 | Tragic 80.4% |
| Immigrants | West Indies | 0.0 /100 | #326 | Tragic 79.5% |
| Immigrants | Senegal | 0.0 /100 | #327 | Tragic 79.0% |