Immigrants from Switzerland vs Malaysian 1 or more Vehicles in Household
COMPARE
Immigrants from Switzerland
Malaysian
1 or more Vehicles in Household
1 or more Vehicles in Household Comparison
Immigrants from Switzerland
Malaysians
87.9%
1 OR MORE VEHICLES IN HOUSEHOLD
0.6/ 100
METRIC RATING
261st/ 347
METRIC RANK
92.3%
1 OR MORE VEHICLES IN HOUSEHOLD
99.9/ 100
METRIC RATING
36th/ 347
METRIC RANK
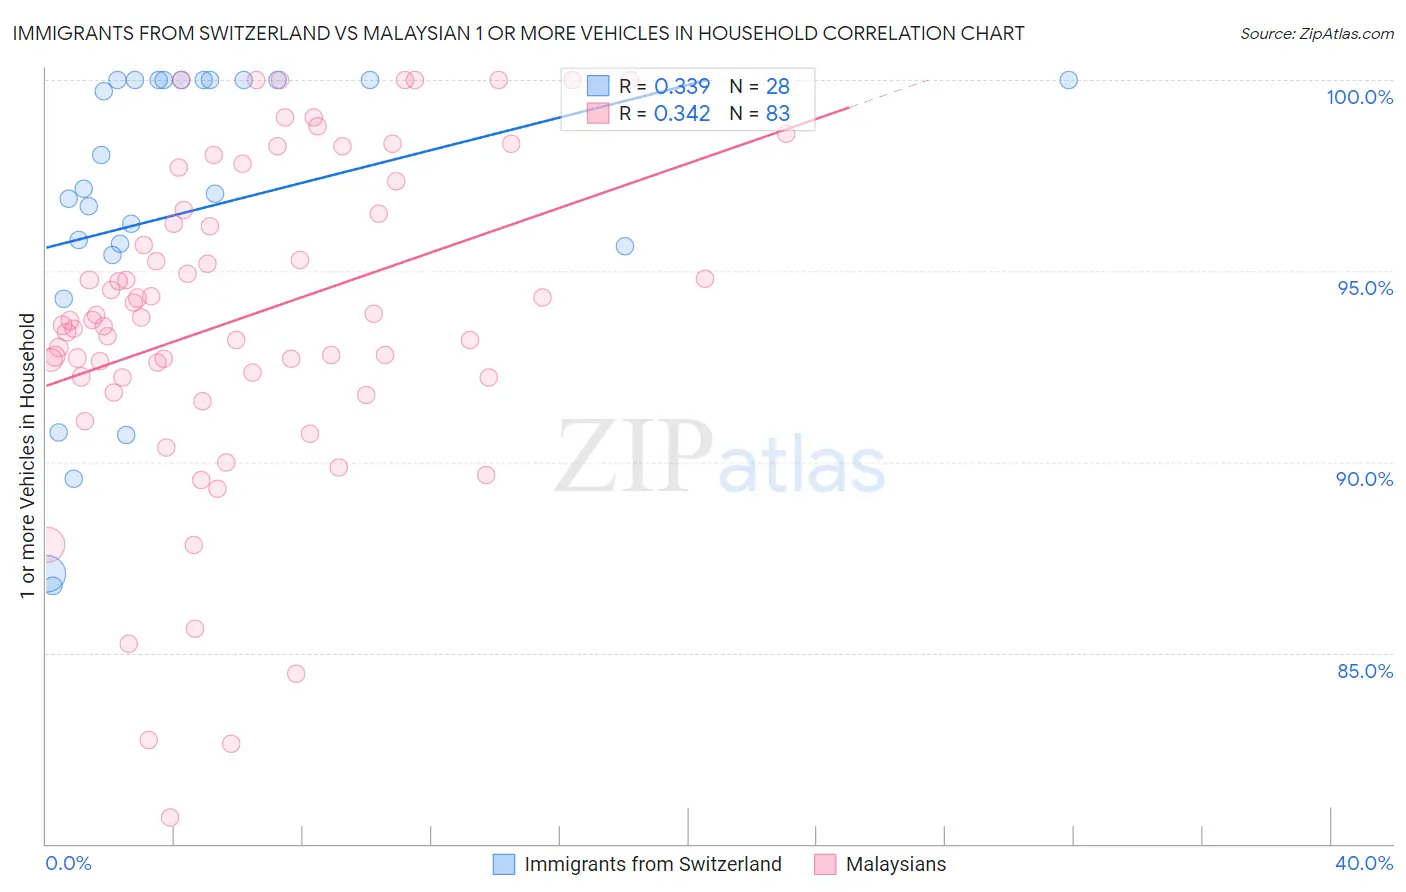
Immigrants from Switzerland vs Malaysian 1 or more Vehicles in Household Correlation Chart
The statistical analysis conducted on geographies consisting of 148,062,168 people shows a mild positive correlation between the proportion of Immigrants from Switzerland and percentage of households with 1 or more vehicles available in the United States with a correlation coefficient (R) of 0.339 and weighted average of 87.9%. Similarly, the statistical analysis conducted on geographies consisting of 226,025,897 people shows a mild positive correlation between the proportion of Malaysians and percentage of households with 1 or more vehicles available in the United States with a correlation coefficient (R) of 0.342 and weighted average of 92.3%, a difference of 5.0%.
1 or more Vehicles in Household Correlation Summary
| Measurement | Immigrants from Switzerland | Malaysian |
| Minimum | 86.7% | 80.7% |
| Maximum | 100.0% | 100.0% |
| Range | 13.3% | 19.3% |
| Mean | 96.6% | 93.8% |
| Median | 97.1% | 93.7% |
| Interquartile 25% (IQ1) | 95.5% | 92.2% |
| Interquartile 75% (IQ3) | 100.0% | 96.6% |
| Interquartile Range (IQR) | 4.5% | 4.4% |
| Standard Deviation (Sample) | 4.1% | 4.2% |
| Standard Deviation (Population) | 4.0% | 4.2% |
Similar Demographics by 1 or more Vehicles in Household
Demographics Similar to Immigrants from Switzerland by 1 or more Vehicles in Household
In terms of 1 or more vehicles in household, the demographic groups most similar to Immigrants from Switzerland are Subsaharan African (87.9%, a difference of 0.030%), Macedonian (87.9%, a difference of 0.040%), Immigrants from Egypt (87.8%, a difference of 0.10%), Immigrants from Liberia (87.8%, a difference of 0.11%), and Nigerian (88.0%, a difference of 0.13%).
| Demographics | Rating | Rank | 1 or more Vehicles in Household |
| Haitians | 0.9 /100 | #254 | Tragic 88.1% |
| Immigrants | Latvia | 0.9 /100 | #255 | Tragic 88.1% |
| Colombians | 0.9 /100 | #256 | Tragic 88.0% |
| Liberians | 0.9 /100 | #257 | Tragic 88.0% |
| South American Indians | 0.9 /100 | #258 | Tragic 88.0% |
| Nigerians | 0.8 /100 | #259 | Tragic 88.0% |
| Macedonians | 0.6 /100 | #260 | Tragic 87.9% |
| Immigrants | Switzerland | 0.6 /100 | #261 | Tragic 87.9% |
| Sub-Saharan Africans | 0.5 /100 | #262 | Tragic 87.9% |
| Immigrants | Egypt | 0.5 /100 | #263 | Tragic 87.8% |
| Immigrants | Liberia | 0.4 /100 | #264 | Tragic 87.8% |
| Africans | 0.4 /100 | #265 | Tragic 87.8% |
| Israelis | 0.3 /100 | #266 | Tragic 87.7% |
| Immigrants | Colombia | 0.3 /100 | #267 | Tragic 87.6% |
| Immigrants | Europe | 0.2 /100 | #268 | Tragic 87.6% |
Demographics Similar to Malaysians by 1 or more Vehicles in Household
In terms of 1 or more vehicles in household, the demographic groups most similar to Malaysians are Czechoslovakian (92.3%, a difference of 0.0%), Italian (92.3%, a difference of 0.010%), French Canadian (92.3%, a difference of 0.010%), Immigrants from Vietnam (92.3%, a difference of 0.010%), and Swiss (92.3%, a difference of 0.020%).
| Demographics | Rating | Rank | 1 or more Vehicles in Household |
| Native Hawaiians | 100.0 /100 | #29 | Exceptional 92.4% |
| Finns | 100.0 /100 | #30 | Exceptional 92.4% |
| Samoans | 100.0 /100 | #31 | Exceptional 92.4% |
| Basques | 100.0 /100 | #32 | Exceptional 92.4% |
| Cherokee | 100.0 /100 | #33 | Exceptional 92.4% |
| Italians | 99.9 /100 | #34 | Exceptional 92.3% |
| Czechoslovakians | 99.9 /100 | #35 | Exceptional 92.3% |
| Malaysians | 99.9 /100 | #36 | Exceptional 92.3% |
| French Canadians | 99.9 /100 | #37 | Exceptional 92.3% |
| Immigrants | Vietnam | 99.9 /100 | #38 | Exceptional 92.3% |
| Swiss | 99.9 /100 | #39 | Exceptional 92.3% |
| Creek | 99.9 /100 | #40 | Exceptional 92.3% |
| Immigrants | Taiwan | 99.9 /100 | #41 | Exceptional 92.3% |
| Chickasaw | 99.9 /100 | #42 | Exceptional 92.3% |
| Spanish | 99.9 /100 | #43 | Exceptional 92.3% |