Immigrants from Sri Lanka vs Lithuanian 1 or more Vehicles in Household
COMPARE
Immigrants from Sri Lanka
Lithuanian
1 or more Vehicles in Household
1 or more Vehicles in Household Comparison
Immigrants from Sri Lanka
Lithuanians
88.9%
1 OR MORE VEHICLES IN HOUSEHOLD
10.2/ 100
METRIC RATING
215th/ 347
METRIC RANK
91.7%
1 OR MORE VEHICLES IN HOUSEHOLD
99.7/ 100
METRIC RATING
70th/ 347
METRIC RANK
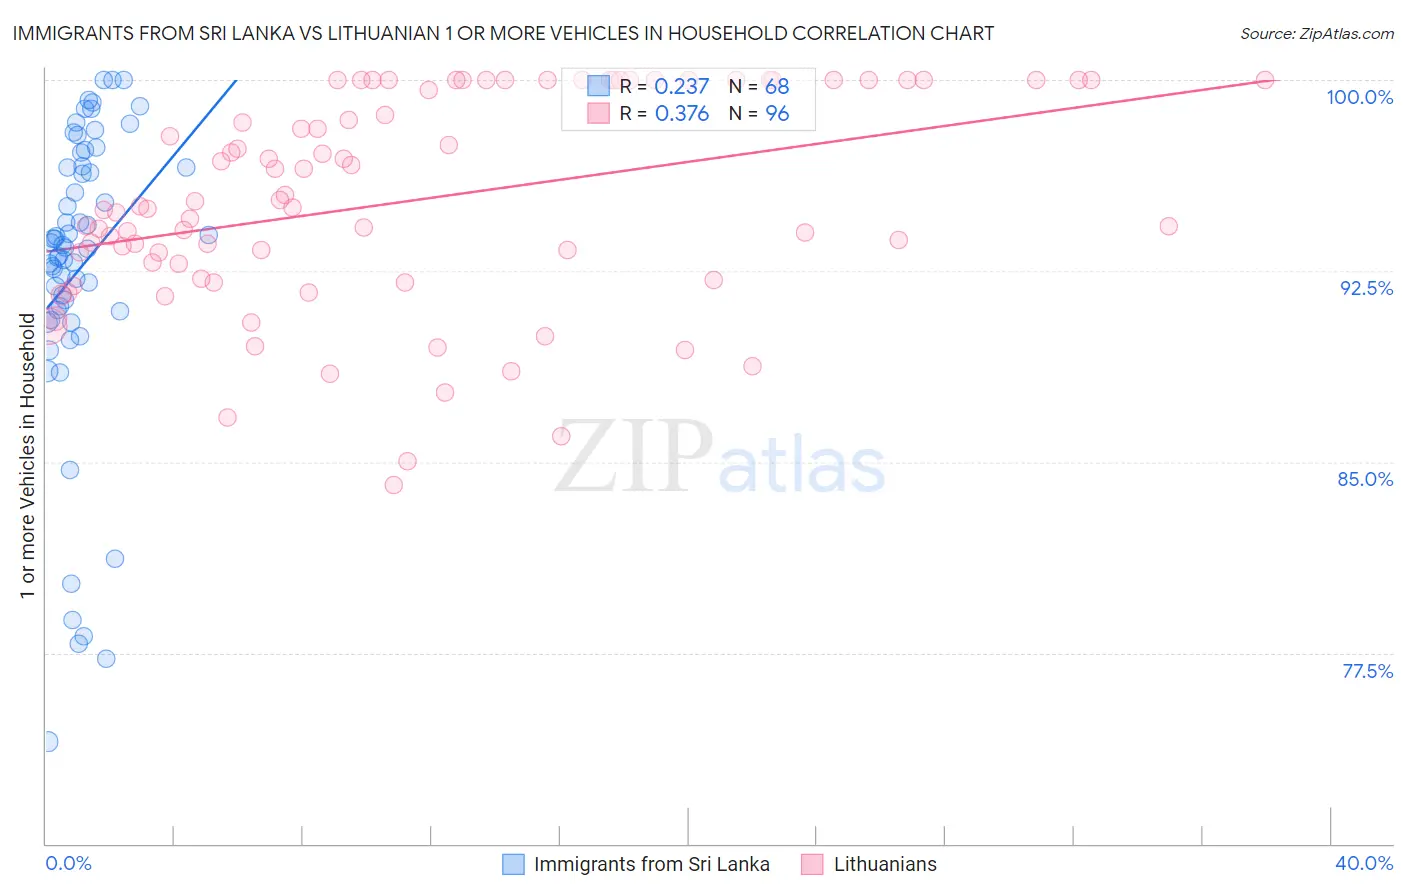
Immigrants from Sri Lanka vs Lithuanian 1 or more Vehicles in Household Correlation Chart
The statistical analysis conducted on geographies consisting of 149,664,383 people shows a weak positive correlation between the proportion of Immigrants from Sri Lanka and percentage of households with 1 or more vehicles available in the United States with a correlation coefficient (R) of 0.237 and weighted average of 88.9%. Similarly, the statistical analysis conducted on geographies consisting of 421,786,963 people shows a mild positive correlation between the proportion of Lithuanians and percentage of households with 1 or more vehicles available in the United States with a correlation coefficient (R) of 0.376 and weighted average of 91.7%, a difference of 3.1%.
1 or more Vehicles in Household Correlation Summary
| Measurement | Immigrants from Sri Lanka | Lithuanian |
| Minimum | 74.0% | 84.1% |
| Maximum | 100.0% | 100.0% |
| Range | 26.0% | 15.9% |
| Mean | 92.6% | 95.3% |
| Median | 93.5% | 95.0% |
| Interquartile 25% (IQ1) | 90.9% | 92.5% |
| Interquartile 75% (IQ3) | 96.6% | 100.0% |
| Interquartile Range (IQR) | 5.7% | 7.5% |
| Standard Deviation (Sample) | 5.9% | 4.2% |
| Standard Deviation (Population) | 5.9% | 4.1% |
Similar Demographics by 1 or more Vehicles in Household
Demographics Similar to Immigrants from Sri Lanka by 1 or more Vehicles in Household
In terms of 1 or more vehicles in household, the demographic groups most similar to Immigrants from Sri Lanka are Immigrants from Argentina (88.9%, a difference of 0.030%), Argentinean (88.9%, a difference of 0.060%), Immigrants from Hungary (89.0%, a difference of 0.070%), Ugandan (88.9%, a difference of 0.070%), and Immigrants from Guatemala (88.9%, a difference of 0.070%).
| Demographics | Rating | Rank | 1 or more Vehicles in Household |
| Immigrants | Chile | 14.4 /100 | #208 | Poor 89.1% |
| Immigrants | Italy | 14.0 /100 | #209 | Poor 89.1% |
| Dutch West Indians | 13.5 /100 | #210 | Poor 89.0% |
| Sierra Leoneans | 13.0 /100 | #211 | Poor 89.0% |
| Somalis | 12.8 /100 | #212 | Poor 89.0% |
| Immigrants | Western Asia | 12.3 /100 | #213 | Poor 89.0% |
| Immigrants | Hungary | 11.9 /100 | #214 | Poor 89.0% |
| Immigrants | Sri Lanka | 10.2 /100 | #215 | Poor 88.9% |
| Immigrants | Argentina | 9.4 /100 | #216 | Tragic 88.9% |
| Argentineans | 8.8 /100 | #217 | Tragic 88.9% |
| Ugandans | 8.7 /100 | #218 | Tragic 88.9% |
| Immigrants | Guatemala | 8.6 /100 | #219 | Tragic 88.9% |
| Immigrants | Zaire | 8.1 /100 | #220 | Tragic 88.8% |
| Peruvians | 7.9 /100 | #221 | Tragic 88.8% |
| Uruguayans | 7.0 /100 | #222 | Tragic 88.8% |
Demographics Similar to Lithuanians by 1 or more Vehicles in Household
In terms of 1 or more vehicles in household, the demographic groups most similar to Lithuanians are Palestinian (91.7%, a difference of 0.020%), Polish (91.7%, a difference of 0.020%), Cajun (91.7%, a difference of 0.020%), Immigrants from Iran (91.7%, a difference of 0.030%), and Immigrants from Scotland (91.8%, a difference of 0.060%).
| Demographics | Rating | Rank | 1 or more Vehicles in Household |
| Chinese | 99.8 /100 | #63 | Exceptional 91.9% |
| Croatians | 99.8 /100 | #64 | Exceptional 91.9% |
| Immigrants | Laos | 99.8 /100 | #65 | Exceptional 91.8% |
| Canadians | 99.8 /100 | #66 | Exceptional 91.8% |
| Spaniards | 99.8 /100 | #67 | Exceptional 91.8% |
| Immigrants | Scotland | 99.7 /100 | #68 | Exceptional 91.8% |
| Palestinians | 99.7 /100 | #69 | Exceptional 91.7% |
| Lithuanians | 99.7 /100 | #70 | Exceptional 91.7% |
| Poles | 99.7 /100 | #71 | Exceptional 91.7% |
| Cajuns | 99.7 /100 | #72 | Exceptional 91.7% |
| Immigrants | Iran | 99.7 /100 | #73 | Exceptional 91.7% |
| Immigrants | Lebanon | 99.6 /100 | #74 | Exceptional 91.6% |
| Portuguese | 99.5 /100 | #75 | Exceptional 91.6% |
| Cubans | 99.5 /100 | #76 | Exceptional 91.5% |
| Immigrants | Philippines | 99.4 /100 | #77 | Exceptional 91.5% |