Immigrants from Sri Lanka vs Lithuanian Male Unemployment

COMPARE

Immigrants from Sri Lanka
Race
Ancestry
AfghanAfricanAlaska NativeAlaskan AthabascanAlbanianAleutAlsatianAmericanApacheArabArapahoArgentineanArmenianAssyrian/Chaldean/SyriacAustralianAustrianBahamianBangladeshiBarbadianBasqueBelgianBelizeanBermudanBhutaneseBlackfeetBolivianBrazilianBritishBritish West IndianBulgarianBurmeseCajunCambodianCanadianCape VerdeanCarpatho RusynCelticCentral AmericanCentral American IndianCherokeeCheyenneChickasawChileanChineseChippewaChoctawColombianColvilleComancheCosta RicanCreeCreekCroatianCrowCubanCypriotCzechCzechoslovakianDanishDelawareDominicanDutchDutch West IndianEastern EuropeanEcuadorianEgyptianEnglishEstonianEthiopianEuropeanFijianFilipinoFinnishFrenchFrench American IndianFrench CanadianGermanGerman RussianGhanaianGreekGuamanian/ChamorroGuatemalanGuyaneseHaitianHmongHonduranHopiHoumaHungarianIcelanderIndian (Asian)IndonesianInupiatIranianIraqiIrishIroquoisIsraeliItalianJamaicanJapaneseJordanianKenyanKiowaKoreanLaotianLatvianLebaneseLiberianLumbeeLuxembourgerMacedonianMalaysianMalteseMarshalleseMenomineeMexicanMexican American IndianMongolianMoroccanNative HawaiianNavajoNepaleseNew ZealanderNicaraguanNigerianNorthern EuropeanNorwegianOkinawanOsageOttawaPaiutePakistaniPalestinianPanamanianParaguayanPennsylvania GermanPeruvianPimaPolishPortuguesePotawatomiPuebloPuerto RicanPuget Sound SalishRomanianRussianSalvadoranSamoanScandinavianScotch-IrishScottishSeminoleSenegaleseSerbianShoshoneSierra LeoneanSiouxSlavicSlovakSloveneSomaliSouth AfricanSouth AmericanSouth American IndianSoviet UnionSpaniardSpanishSpanish AmericanSpanish American IndianSri LankanSubsaharan AfricanSudaneseSwedishSwissSyrianTaiwaneseThaiTlingit-HaidaTohono O'OdhamTonganTrinidadian and TobagonianTsimshianTurkishU.S. Virgin IslanderUgandanUkrainianUruguayanUteVenezuelanVietnameseWelshWest IndianYakamaYaquiYugoslavianYumanYup'ikZimbabwean
Immigration
NonimmigrantsImmigrantsAfghanistanAfricaAlbaniaArgentinaArmeniaAsiaAustraliaAustriaBahamasBangladeshBarbadosBelarusBelgiumBelizeBoliviaBosnia and HerzegovinaBrazilBulgariaBurma/MyanmarCabo VerdeCambodiaCameroonCanadaCaribbeanCentral AmericaChileChinaColombiaCongoCosta RicaCroatiaCubaCzechoslovakiaDenmarkDominicaDominican RepublicEastern AfricaEastern AsiaEastern EuropeEcuadorEgyptEl SalvadorEnglandEritreaEthiopiaEuropeFijiFranceGermanyGhanaGreeceGrenadaGuatemalaGuyanaHaitiHondurasHong KongHungaryIndiaIndonesiaIranIraqIrelandIsraelItalyJamaicaJapanJordanKazakhstanKenyaKoreaKuwaitLaosLatin AmericaLatviaLebanonLiberiaLithuaniaMalaysiaMexicoMicronesiaMiddle AfricaMoldovaMoroccoNepalNetherlandsNicaraguaNigeriaNorth AmericaNorth MacedoniaNorthern AfricaNorthern EuropeNorwayOceaniaPakistanPanamaPeruPhilippinesPolandPortugalRomaniaRussiaSaudi ArabiaScotlandSenegalSerbiaSierra LeoneSingaporeSomaliaSouth AfricaSouth AmericaSouth Central AsiaSouth Eastern AsiaSouthern EuropeSpainSri LankaSt. Vincent and the GrenadinesSudanSwedenSwitzerlandSyriaTaiwanThailandTrinidad and TobagoTurkeyUgandaUkraineUruguayUzbekistanVenezuelaVietnamWest IndiesWestern AfricaWestern AsiaWestern EuropeYemenZaireZimbabweAzores
Lithuanian
Race
Ancestry
AfghanAfricanAlaska NativeAlaskan AthabascanAlbanianAleutAlsatianAmericanApacheArabArapahoArgentineanArmenianAssyrian/Chaldean/SyriacAustralianAustrianBahamianBangladeshiBarbadianBasqueBelgianBelizeanBermudanBhutaneseBlackfeetBolivianBrazilianBritishBritish West IndianBulgarianBurmeseCajunCambodianCanadianCape VerdeanCarpatho RusynCelticCentral AmericanCentral American IndianCherokeeCheyenneChickasawChileanChineseChippewaChoctawColombianColvilleComancheCosta RicanCreeCreekCroatianCrowCubanCypriotCzechCzechoslovakianDanishDelawareDominicanDutchDutch West IndianEastern EuropeanEcuadorianEgyptianEnglishEstonianEthiopianEuropeanFijianFilipinoFinnishFrenchFrench American IndianFrench CanadianGermanGerman RussianGhanaianGreekGuamanian/ChamorroGuatemalanGuyaneseHaitianHmongHonduranHopiHoumaHungarianIcelanderIndian (Asian)IndonesianInupiatIranianIraqiIrishIroquoisIsraeliItalianJamaicanJapaneseJordanianKenyanKiowaKoreanLaotianLatvianLebaneseLiberianLithuanianLumbeeLuxembourgerMacedonianMalaysianMalteseMarshalleseMenomineeMexicanMexican American IndianMongolianMoroccanNative HawaiianNavajoNepaleseNew ZealanderNicaraguanNigerianNorthern EuropeanNorwegianOkinawanOsageOttawaPaiutePakistaniPalestinianPanamanianParaguayanPennsylvania GermanPeruvianPimaPolishPortuguesePotawatomiPuebloPuerto RicanPuget Sound SalishRomanianRussianSalvadoranSamoanScandinavianScotch-IrishScottishSeminoleSenegaleseSerbianShoshoneSierra LeoneanSiouxSlavicSlovakSloveneSomaliSouth AfricanSouth AmericanSouth American IndianSoviet UnionSpaniardSpanishSpanish AmericanSpanish American IndianSri LankanSubsaharan AfricanSudaneseSwedishSwissSyrianTaiwaneseThaiTlingit-HaidaTohono O'OdhamTonganTrinidadian and TobagonianTsimshianTurkishU.S. Virgin IslanderUgandanUkrainianUruguayanUteVenezuelanVietnameseWelshWest IndianYakamaYaquiYugoslavianYumanYup'ikZimbabwean
Immigration
NonimmigrantsImmigrantsAfghanistanAfricaAlbaniaArgentinaArmeniaAsiaAustraliaAustriaBahamasBangladeshBarbadosBelarusBelgiumBelizeBoliviaBosnia and HerzegovinaBrazilBulgariaBurma/MyanmarCabo VerdeCambodiaCameroonCanadaCaribbeanCentral AmericaChileChinaColombiaCongoCosta RicaCroatiaCubaCzechoslovakiaDenmarkDominicaDominican RepublicEastern AfricaEastern AsiaEastern EuropeEcuadorEgyptEl SalvadorEnglandEritreaEthiopiaEuropeFijiFranceGermanyGhanaGreeceGrenadaGuatemalaGuyanaHaitiHondurasHong KongHungaryIndiaIndonesiaIranIraqIrelandIsraelItalyJamaicaJapanJordanKazakhstanKenyaKoreaKuwaitLaosLatin AmericaLatviaLebanonLiberiaLithuaniaMalaysiaMexicoMicronesiaMiddle AfricaMoldovaMoroccoNepalNetherlandsNicaraguaNigeriaNorth AmericaNorth MacedoniaNorthern AfricaNorthern EuropeNorwayOceaniaPakistanPanamaPeruPhilippinesPolandPortugalRomaniaRussiaSaudi ArabiaScotlandSenegalSerbiaSierra LeoneSingaporeSomaliaSouth AfricaSouth AmericaSouth Central AsiaSouth Eastern AsiaSouthern EuropeSpainSt. Vincent and the GrenadinesSudanSwedenSwitzerlandSyriaTaiwanThailandTrinidad and TobagoTurkeyUgandaUkraineUruguayUzbekistanVenezuelaVietnamWest IndiesWestern AfricaWestern AsiaWestern EuropeYemenZaireZimbabweAzores
Male Unemployment
Income
Poverty
Unemployment
Labor Participation
Family Structure
Vehicle Availability
Education Level
Disability

Male Unemployment Comparison

Immigrants from Sri Lanka

Lithuanians

Exceptional
Exceptional
5.1%
MALE UNEMPLOYMENT
94.9/ 100
METRIC RATING
88th/ 347
METRIC RANK
5.0%
MALE UNEMPLOYMENT
98.5/ 100
METRIC RATING
58th/ 347
METRIC RANK

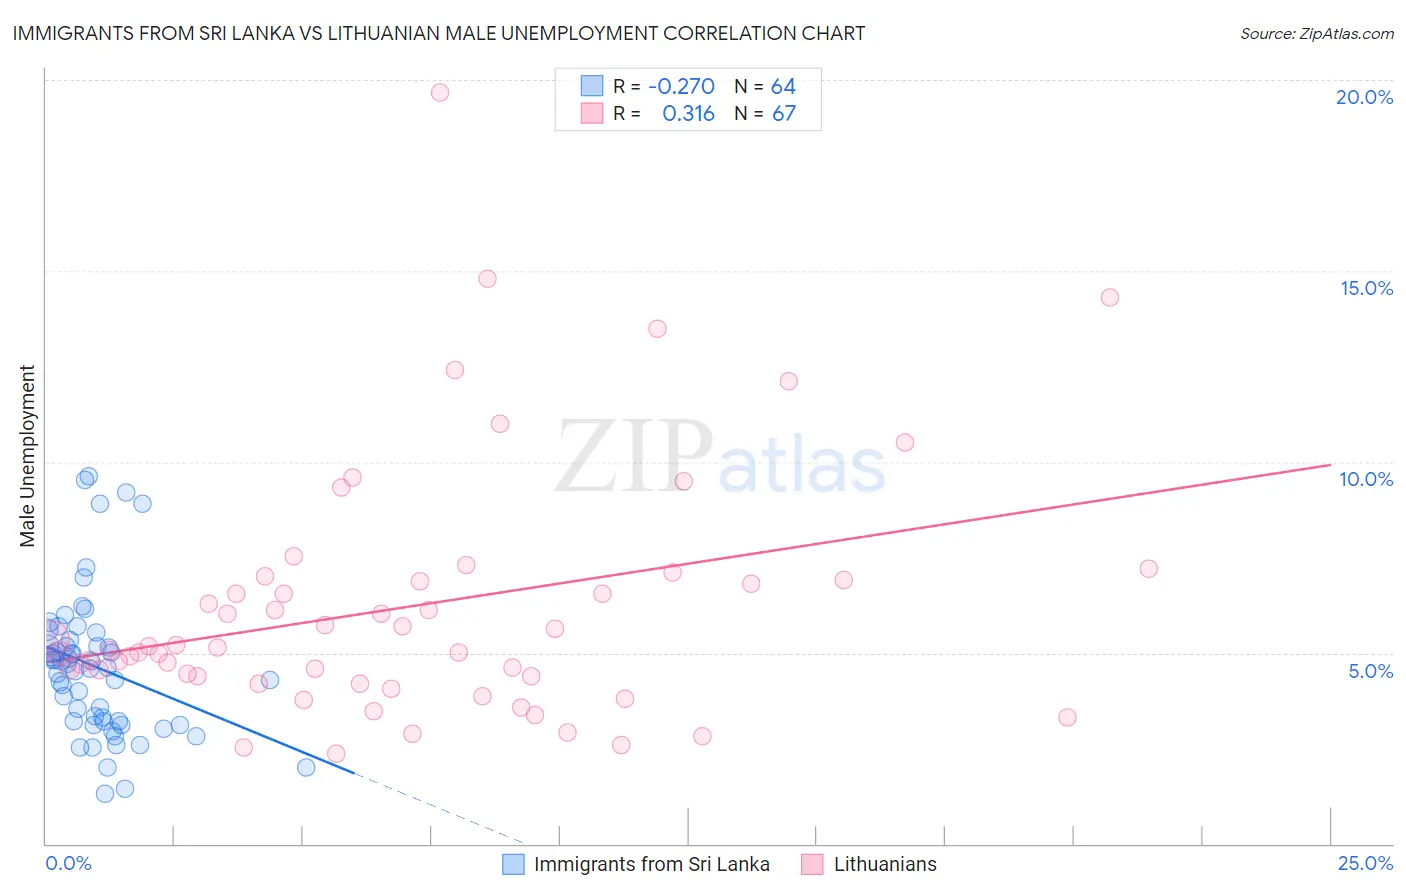
Immigrants from Sri Lanka vs Lithuanian Male Unemployment Correlation Chart

The statistical analysis conducted on geographies consisting of 149,610,733 people shows a weak negative correlation between the proportion of Immigrants from Sri Lanka and unemployment rate among males in the United States with a correlation coefficient (R) of -0.270 and weighted average of 5.1%. Similarly, the statistical analysis conducted on geographies consisting of 419,508,193 people shows a mild positive correlation between the proportion of Lithuanians and unemployment rate among males in the United States with a correlation coefficient (R) of 0.316 and weighted average of 5.0%, a difference of 2.0%.
Immigrants from Sri Lanka vs Lithuanian Male Unemployment

Male Unemployment Correlation Summary

MeasurementImmigrants from Sri LankaLithuanian
Minimum1.3%2.4%
Maximum9.6%19.7%
Range8.3%17.3%
Mean4.6%6.2%
Median4.6%5.2%
Interquartile 25% (IQ1)3.2%4.4%
Interquartile 75% (IQ3)5.3%6.9%
Interquartile Range (IQR)2.1%2.5%
Standard Deviation (Sample)1.9%3.3%
Standard Deviation (Population)1.8%3.2%

Similar Demographics by Male Unemployment

Demographics Similar to Immigrants from Sri Lanka by Male Unemployment

In terms of male unemployment, the demographic groups most similar to Immigrants from Sri Lanka are Immigrants from Australia (5.1%, a difference of 0.040%), Okinawan (5.1%, a difference of 0.040%), Immigrants from Turkey (5.1%, a difference of 0.13%), Slavic (5.1%, a difference of 0.18%), and Immigrants from Serbia (5.1%, a difference of 0.18%).
DemographicsRating | RankMale Unemployment
French
96.2
/100
|
#81
Exceptional
5.0%
Chileans
96.2
/100
|
#82
Exceptional
5.0%
Immigrants | Eritrea
96.0
/100
|
#83
Exceptional
5.0%
Serbians
95.7
/100
|
#84
Exceptional
5.1%
Immigrants | North Macedonia
95.6
/100
|
#85
Exceptional
5.1%
Maltese
95.5
/100
|
#86
Exceptional
5.1%
Immigrants | Romania
95.4
/100
|
#87
Exceptional
5.1%
Immigrants | Sri Lanka
94.9
/100
|
#88
Exceptional
5.1%
Immigrants | Australia
94.7
/100
|
#89
Exceptional
5.1%
Okinawans
94.7
/100
|
#90
Exceptional
5.1%
Immigrants | Turkey
94.4
/100
|
#91
Exceptional
5.1%
Slavs
94.2
/100
|
#92
Exceptional
5.1%
Immigrants | Serbia
94.2
/100
|
#93
Exceptional
5.1%
Canadians
94.1
/100
|
#94
Exceptional
5.1%
Italians
93.8
/100
|
#95
Exceptional
5.1%

Demographics Similar to Lithuanians by Male Unemployment

In terms of male unemployment, the demographic groups most similar to Lithuanians are Turkish (5.0%, a difference of 0.0%), Immigrants from Netherlands (5.0%, a difference of 0.14%), Immigrants from Bulgaria (5.0%, a difference of 0.23%), Yugoslavian (5.0%, a difference of 0.24%), and Czechoslovakian (5.0%, a difference of 0.24%).
DemographicsRating | RankMale Unemployment
Slovenes
98.8
/100
|
#51
Exceptional
5.0%
Irish
98.8
/100
|
#52
Exceptional
5.0%
Jordanians
98.8
/100
|
#53
Exceptional
5.0%
Yugoslavians
98.7
/100
|
#54
Exceptional
5.0%
Czechoslovakians
98.7
/100
|
#55
Exceptional
5.0%
Immigrants | Bulgaria
98.7
/100
|
#56
Exceptional
5.0%
Turks
98.5
/100
|
#57
Exceptional
5.0%
Lithuanians
98.5
/100
|
#58
Exceptional
5.0%
Immigrants | Netherlands
98.3
/100
|
#59
Exceptional
5.0%
Immigrants | Argentina
98.1
/100
|
#60
Exceptional
5.0%
Cambodians
98.1
/100
|
#61
Exceptional
5.0%
Basques
97.9
/100
|
#62
Exceptional
5.0%
Eastern Europeans
97.9
/100
|
#63
Exceptional
5.0%
Celtics
97.8
/100
|
#64
Exceptional
5.0%
Icelanders
97.6
/100
|
#65
Exceptional
5.0%