Chickasaw vs Lithuanian 1 or more Vehicles in Household
COMPARE
Chickasaw
Lithuanian
1 or more Vehicles in Household
1 or more Vehicles in Household Comparison
Chickasaw
Lithuanians
92.3%
1 OR MORE VEHICLES IN HOUSEHOLD
99.9/ 100
METRIC RATING
42nd/ 347
METRIC RANK
91.7%
1 OR MORE VEHICLES IN HOUSEHOLD
99.7/ 100
METRIC RATING
70th/ 347
METRIC RANK
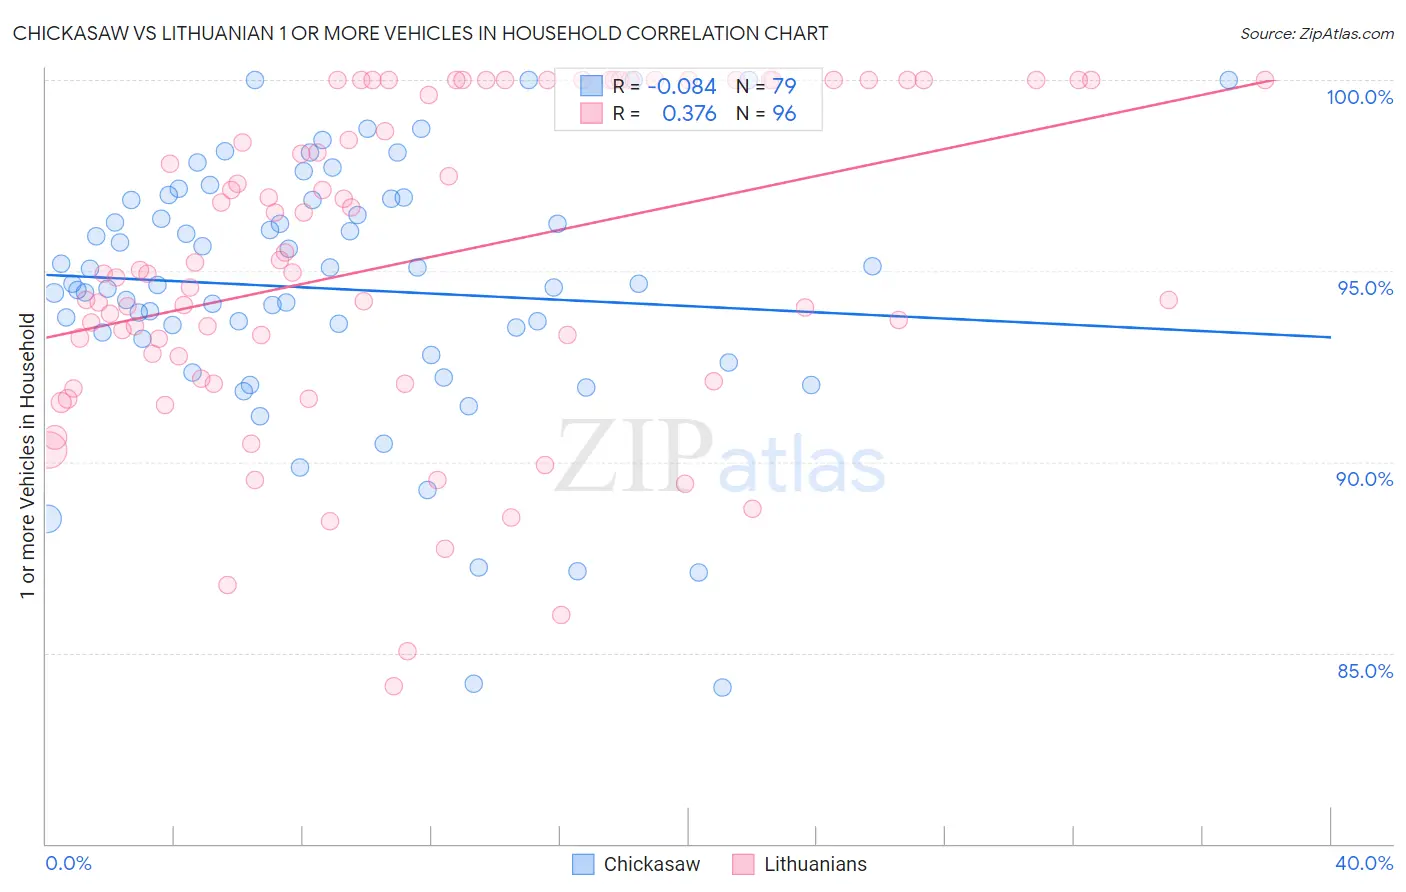
Chickasaw vs Lithuanian 1 or more Vehicles in Household Correlation Chart
The statistical analysis conducted on geographies consisting of 147,674,268 people shows a slight negative correlation between the proportion of Chickasaw and percentage of households with 1 or more vehicles available in the United States with a correlation coefficient (R) of -0.084 and weighted average of 92.3%. Similarly, the statistical analysis conducted on geographies consisting of 421,786,963 people shows a mild positive correlation between the proportion of Lithuanians and percentage of households with 1 or more vehicles available in the United States with a correlation coefficient (R) of 0.376 and weighted average of 91.7%, a difference of 0.62%.
1 or more Vehicles in Household Correlation Summary
| Measurement | Chickasaw | Lithuanian |
| Minimum | 84.1% | 84.1% |
| Maximum | 100.0% | 100.0% |
| Range | 15.9% | 15.9% |
| Mean | 94.5% | 95.3% |
| Median | 94.7% | 95.0% |
| Interquartile 25% (IQ1) | 93.2% | 92.5% |
| Interquartile 75% (IQ3) | 96.8% | 100.0% |
| Interquartile Range (IQR) | 3.6% | 7.5% |
| Standard Deviation (Sample) | 3.4% | 4.2% |
| Standard Deviation (Population) | 3.4% | 4.1% |
Similar Demographics by 1 or more Vehicles in Household
Demographics Similar to Chickasaw by 1 or more Vehicles in Household
In terms of 1 or more vehicles in household, the demographic groups most similar to Chickasaw are Spanish (92.3%, a difference of 0.0%), Immigrants from Taiwan (92.3%, a difference of 0.010%), Choctaw (92.2%, a difference of 0.020%), Swiss (92.3%, a difference of 0.030%), and Creek (92.3%, a difference of 0.030%).
| Demographics | Rating | Rank | 1 or more Vehicles in Household |
| Czechoslovakians | 99.9 /100 | #35 | Exceptional 92.3% |
| Malaysians | 99.9 /100 | #36 | Exceptional 92.3% |
| French Canadians | 99.9 /100 | #37 | Exceptional 92.3% |
| Immigrants | Vietnam | 99.9 /100 | #38 | Exceptional 92.3% |
| Swiss | 99.9 /100 | #39 | Exceptional 92.3% |
| Creek | 99.9 /100 | #40 | Exceptional 92.3% |
| Immigrants | Taiwan | 99.9 /100 | #41 | Exceptional 92.3% |
| Chickasaw | 99.9 /100 | #42 | Exceptional 92.3% |
| Spanish | 99.9 /100 | #43 | Exceptional 92.3% |
| Choctaw | 99.9 /100 | #44 | Exceptional 92.2% |
| Immigrants | Nonimmigrants | 99.9 /100 | #45 | Exceptional 92.2% |
| Immigrants | Fiji | 99.9 /100 | #46 | Exceptional 92.2% |
| Northern Europeans | 99.9 /100 | #47 | Exceptional 92.2% |
| Belgians | 99.9 /100 | #48 | Exceptional 92.1% |
| Afghans | 99.9 /100 | #49 | Exceptional 92.1% |
Demographics Similar to Lithuanians by 1 or more Vehicles in Household
In terms of 1 or more vehicles in household, the demographic groups most similar to Lithuanians are Palestinian (91.7%, a difference of 0.020%), Polish (91.7%, a difference of 0.020%), Cajun (91.7%, a difference of 0.020%), Immigrants from Iran (91.7%, a difference of 0.030%), and Immigrants from Scotland (91.8%, a difference of 0.060%).
| Demographics | Rating | Rank | 1 or more Vehicles in Household |
| Chinese | 99.8 /100 | #63 | Exceptional 91.9% |
| Croatians | 99.8 /100 | #64 | Exceptional 91.9% |
| Immigrants | Laos | 99.8 /100 | #65 | Exceptional 91.8% |
| Canadians | 99.8 /100 | #66 | Exceptional 91.8% |
| Spaniards | 99.8 /100 | #67 | Exceptional 91.8% |
| Immigrants | Scotland | 99.7 /100 | #68 | Exceptional 91.8% |
| Palestinians | 99.7 /100 | #69 | Exceptional 91.7% |
| Lithuanians | 99.7 /100 | #70 | Exceptional 91.7% |
| Poles | 99.7 /100 | #71 | Exceptional 91.7% |
| Cajuns | 99.7 /100 | #72 | Exceptional 91.7% |
| Immigrants | Iran | 99.7 /100 | #73 | Exceptional 91.7% |
| Immigrants | Lebanon | 99.6 /100 | #74 | Exceptional 91.6% |
| Portuguese | 99.5 /100 | #75 | Exceptional 91.6% |
| Cubans | 99.5 /100 | #76 | Exceptional 91.5% |
| Immigrants | Philippines | 99.4 /100 | #77 | Exceptional 91.5% |