Immigrants from Sierra Leone vs Immigrants from Honduras No Vehicles in Household
COMPARE
Immigrants from Sierra Leone
Immigrants from Honduras
No Vehicles in Household
No Vehicles in Household Comparison
Immigrants from Sierra Leone
Immigrants from Honduras
11.3%
NO VEHICLES IN HOUSEHOLD
6.4/ 100
METRIC RATING
225th/ 347
METRIC RANK
11.8%
NO VEHICLES IN HOUSEHOLD
2.1/ 100
METRIC RATING
245th/ 347
METRIC RANK
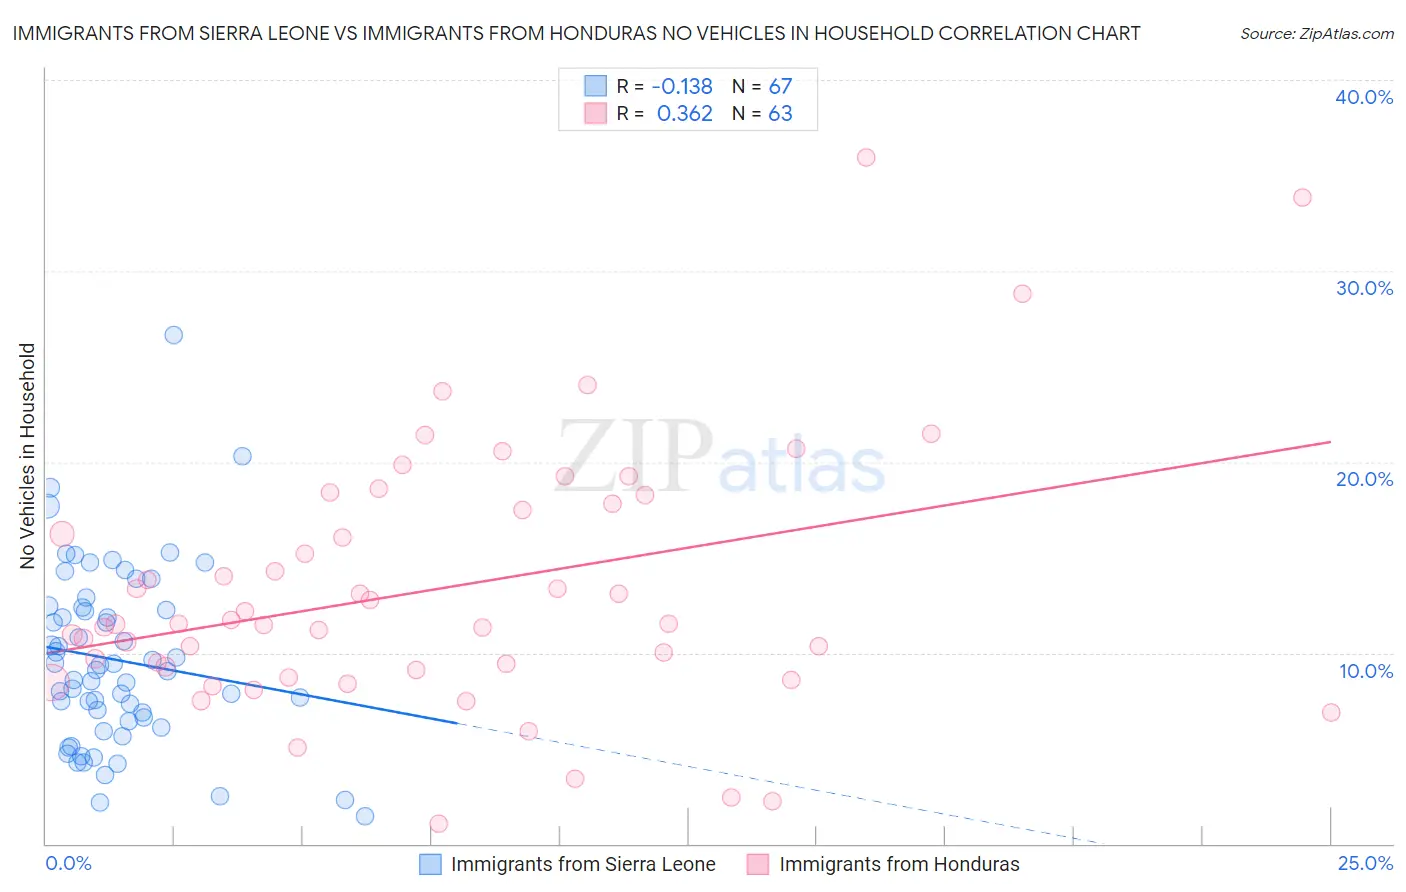
Immigrants from Sierra Leone vs Immigrants from Honduras No Vehicles in Household Correlation Chart
The statistical analysis conducted on geographies consisting of 101,627,195 people shows a poor negative correlation between the proportion of Immigrants from Sierra Leone and percentage of households with no vehicle available in the United States with a correlation coefficient (R) of -0.138 and weighted average of 11.3%. Similarly, the statistical analysis conducted on geographies consisting of 322,146,811 people shows a mild positive correlation between the proportion of Immigrants from Honduras and percentage of households with no vehicle available in the United States with a correlation coefficient (R) of 0.362 and weighted average of 11.8%, a difference of 3.6%.
No Vehicles in Household Correlation Summary
| Measurement | Immigrants from Sierra Leone | Immigrants from Honduras |
| Minimum | 1.4% | 1.0% |
| Maximum | 26.6% | 35.9% |
| Range | 25.2% | 34.9% |
| Mean | 9.6% | 13.3% |
| Median | 9.1% | 11.5% |
| Interquartile 25% (IQ1) | 6.4% | 9.1% |
| Interquartile 75% (IQ3) | 12.4% | 17.8% |
| Interquartile Range (IQR) | 6.0% | 8.7% |
| Standard Deviation (Sample) | 4.7% | 6.9% |
| Standard Deviation (Population) | 4.6% | 6.8% |
Demographics Similar to Immigrants from Sierra Leone and Immigrants from Honduras by No Vehicles in Household
In terms of no vehicles in household, the demographic groups most similar to Immigrants from Sierra Leone are Immigrants from Somalia (11.4%, a difference of 0.55%), Immigrants from Pakistan (11.4%, a difference of 0.57%), Immigrants from Romania (11.4%, a difference of 0.62%), Ugandan (11.4%, a difference of 0.66%), and Immigrants from Norway (11.4%, a difference of 0.78%). Similarly, the demographic groups most similar to Immigrants from Honduras are Immigrants from Portugal (11.7%, a difference of 0.19%), Cheyenne (11.7%, a difference of 0.37%), Turkish (11.7%, a difference of 0.70%), Eastern European (11.7%, a difference of 0.81%), and Immigrants (11.7%, a difference of 0.82%).
| Demographics | Rating | Rank | No Vehicles in Household |
| Immigrants | Sierra Leone | 6.4 /100 | #225 | Tragic 11.3% |
| Immigrants | Somalia | 5.4 /100 | #226 | Tragic 11.4% |
| Immigrants | Pakistan | 5.4 /100 | #227 | Tragic 11.4% |
| Immigrants | Romania | 5.3 /100 | #228 | Tragic 11.4% |
| Ugandans | 5.3 /100 | #229 | Tragic 11.4% |
| Immigrants | Norway | 5.1 /100 | #230 | Tragic 11.4% |
| Immigrants | Japan | 5.1 /100 | #231 | Tragic 11.4% |
| Immigrants | Turkey | 4.8 /100 | #232 | Tragic 11.5% |
| Houma | 4.7 /100 | #233 | Tragic 11.5% |
| Immigrants | Peru | 4.5 /100 | #234 | Tragic 11.5% |
| Kiowa | 4.0 /100 | #235 | Tragic 11.5% |
| Cree | 3.5 /100 | #236 | Tragic 11.6% |
| Ute | 3.3 /100 | #237 | Tragic 11.6% |
| Russians | 3.2 /100 | #238 | Tragic 11.6% |
| Taiwanese | 2.8 /100 | #239 | Tragic 11.7% |
| Immigrants | Immigrants | 2.7 /100 | #240 | Tragic 11.7% |
| Eastern Europeans | 2.7 /100 | #241 | Tragic 11.7% |
| Turks | 2.6 /100 | #242 | Tragic 11.7% |
| Cheyenne | 2.4 /100 | #243 | Tragic 11.7% |
| Immigrants | Portugal | 2.2 /100 | #244 | Tragic 11.7% |
| Immigrants | Honduras | 2.1 /100 | #245 | Tragic 11.8% |