Immigrants from Peru vs Immigrants from Mexico 2 or more Vehicles in Household
COMPARE
Immigrants from Peru
Immigrants from Mexico
2 or more Vehicles in Household
2 or more Vehicles in Household Comparison
Immigrants from Peru
Immigrants from Mexico
54.4%
2 OR MORE VEHICLES IN HOUSEHOLD
14.3/ 100
METRIC RATING
203rd/ 347
METRIC RANK
60.2%
2 OR MORE VEHICLES IN HOUSEHOLD
100.0/ 100
METRIC RATING
33rd/ 347
METRIC RANK
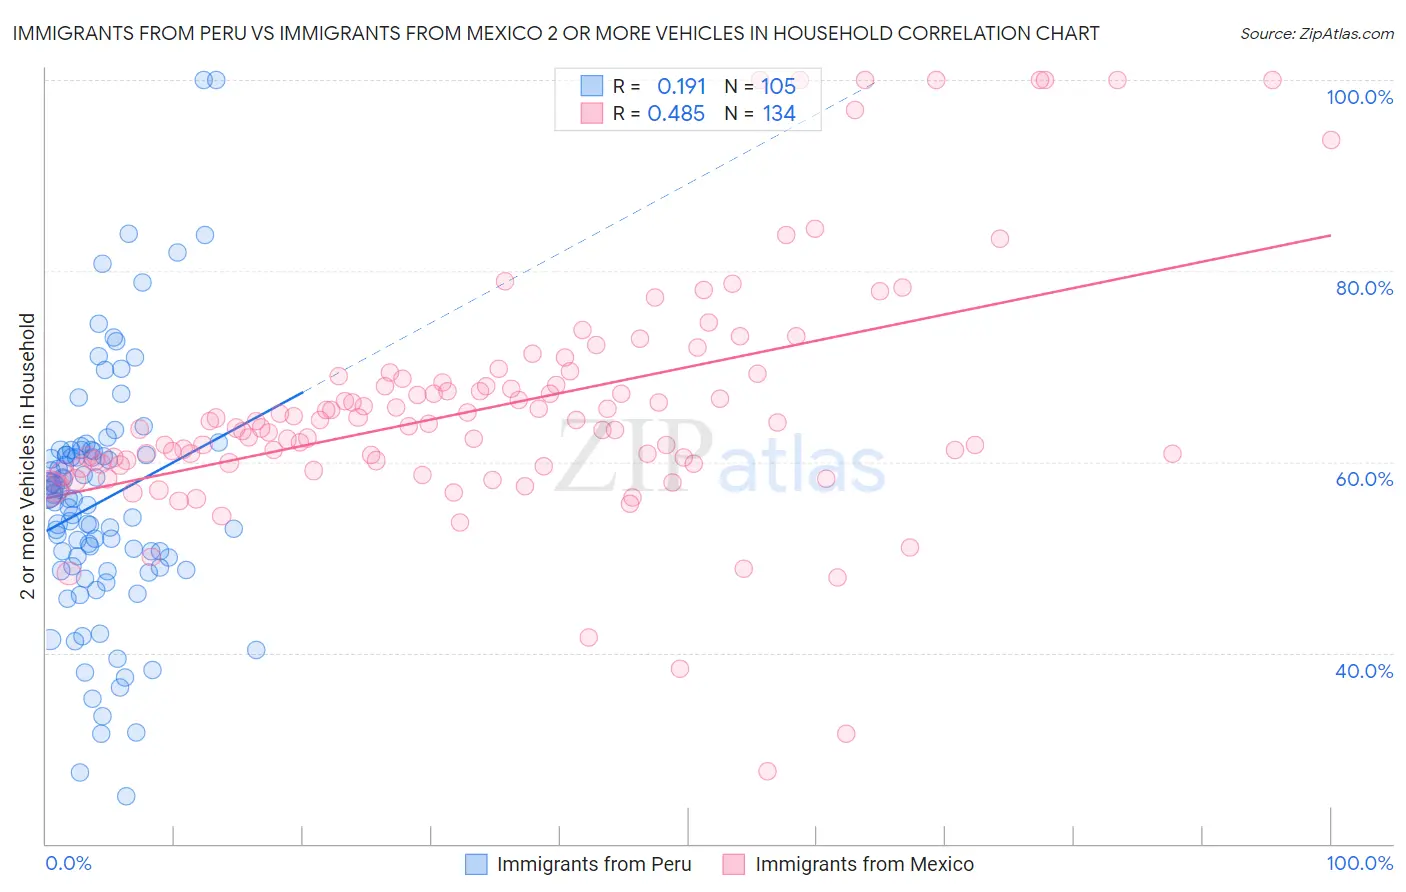
Immigrants from Peru vs Immigrants from Mexico 2 or more Vehicles in Household Correlation Chart
The statistical analysis conducted on geographies consisting of 328,775,084 people shows a poor positive correlation between the proportion of Immigrants from Peru and percentage of households with 2 or more vehicles available in the United States with a correlation coefficient (R) of 0.191 and weighted average of 54.4%. Similarly, the statistical analysis conducted on geographies consisting of 513,439,462 people shows a moderate positive correlation between the proportion of Immigrants from Mexico and percentage of households with 2 or more vehicles available in the United States with a correlation coefficient (R) of 0.485 and weighted average of 60.2%, a difference of 10.8%.
2 or more Vehicles in Household Correlation Summary
| Measurement | Immigrants from Peru | Immigrants from Mexico |
| Minimum | 24.9% | 27.6% |
| Maximum | 100.0% | 100.0% |
| Range | 75.1% | 72.4% |
| Mean | 55.9% | 65.8% |
| Median | 56.1% | 63.9% |
| Interquartile 25% (IQ1) | 48.8% | 59.9% |
| Interquartile 75% (IQ3) | 61.2% | 68.7% |
| Interquartile Range (IQR) | 12.4% | 8.9% |
| Standard Deviation (Sample) | 13.0% | 12.6% |
| Standard Deviation (Population) | 13.0% | 12.6% |
Similar Demographics by 2 or more Vehicles in Household
Demographics Similar to Immigrants from Peru by 2 or more Vehicles in Household
In terms of 2 or more vehicles in household, the demographic groups most similar to Immigrants from Peru are Immigrants from North Macedonia (54.4%, a difference of 0.040%), Immigrants from Belgium (54.3%, a difference of 0.050%), Cheyenne (54.3%, a difference of 0.060%), Immigrants from Italy (54.4%, a difference of 0.090%), and Immigrants from Latin America (54.3%, a difference of 0.11%).
| Demographics | Rating | Rank | 2 or more Vehicles in Household |
| Immigrants | Poland | 19.3 /100 | #196 | Poor 54.6% |
| Argentineans | 17.5 /100 | #197 | Poor 54.5% |
| Carpatho Rusyns | 16.2 /100 | #198 | Poor 54.4% |
| Immigrants | Norway | 15.9 /100 | #199 | Poor 54.4% |
| Houma | 15.8 /100 | #200 | Poor 54.4% |
| Immigrants | Italy | 15.5 /100 | #201 | Poor 54.4% |
| Immigrants | North Macedonia | 14.9 /100 | #202 | Poor 54.4% |
| Immigrants | Peru | 14.3 /100 | #203 | Poor 54.4% |
| Immigrants | Belgium | 13.7 /100 | #204 | Poor 54.3% |
| Cheyenne | 13.6 /100 | #205 | Poor 54.3% |
| Immigrants | Latin America | 13.1 /100 | #206 | Poor 54.3% |
| Turks | 13.0 /100 | #207 | Poor 54.3% |
| Egyptians | 12.0 /100 | #208 | Poor 54.3% |
| Immigrants | Bulgaria | 12.0 /100 | #209 | Poor 54.3% |
| Immigrants | Saudi Arabia | 11.3 /100 | #210 | Poor 54.2% |
Demographics Similar to Immigrants from Mexico by 2 or more Vehicles in Household
In terms of 2 or more vehicles in household, the demographic groups most similar to Immigrants from Mexico are Spanish (60.2%, a difference of 0.050%), Arapaho (60.2%, a difference of 0.060%), Spanish American Indian (60.3%, a difference of 0.16%), Immigrants from Philippines (60.1%, a difference of 0.17%), and Finnish (60.3%, a difference of 0.19%).
| Demographics | Rating | Rank | 2 or more Vehicles in Household |
| Welsh | 100.0 /100 | #26 | Exceptional 60.8% |
| Assyrians/Chaldeans/Syriacs | 100.0 /100 | #27 | Exceptional 60.5% |
| Guamanians/Chamorros | 100.0 /100 | #28 | Exceptional 60.5% |
| Hawaiians | 100.0 /100 | #29 | Exceptional 60.4% |
| Finns | 100.0 /100 | #30 | Exceptional 60.3% |
| Spanish American Indians | 100.0 /100 | #31 | Exceptional 60.3% |
| Arapaho | 100.0 /100 | #32 | Exceptional 60.2% |
| Immigrants | Mexico | 100.0 /100 | #33 | Exceptional 60.2% |
| Spanish | 100.0 /100 | #34 | Exceptional 60.2% |
| Immigrants | Philippines | 100.0 /100 | #35 | Exceptional 60.1% |
| Chinese | 100.0 /100 | #36 | Exceptional 60.1% |
| Irish | 100.0 /100 | #37 | Exceptional 60.1% |
| Americans | 100.0 /100 | #38 | Exceptional 60.0% |
| British | 100.0 /100 | #39 | Exceptional 60.0% |
| Cherokee | 100.0 /100 | #40 | Exceptional 59.9% |