Burmese vs Uruguayan 1 or more Vehicles in Household
COMPARE
Burmese
Uruguayan
1 or more Vehicles in Household
1 or more Vehicles in Household Comparison
Burmese
Uruguayans
90.4%
1 OR MORE VEHICLES IN HOUSEHOLD
89.0/ 100
METRIC RATING
128th/ 347
METRIC RANK
88.8%
1 OR MORE VEHICLES IN HOUSEHOLD
7.0/ 100
METRIC RATING
222nd/ 347
METRIC RANK
Burmese vs Uruguayan 1 or more Vehicles in Household Correlation Chart
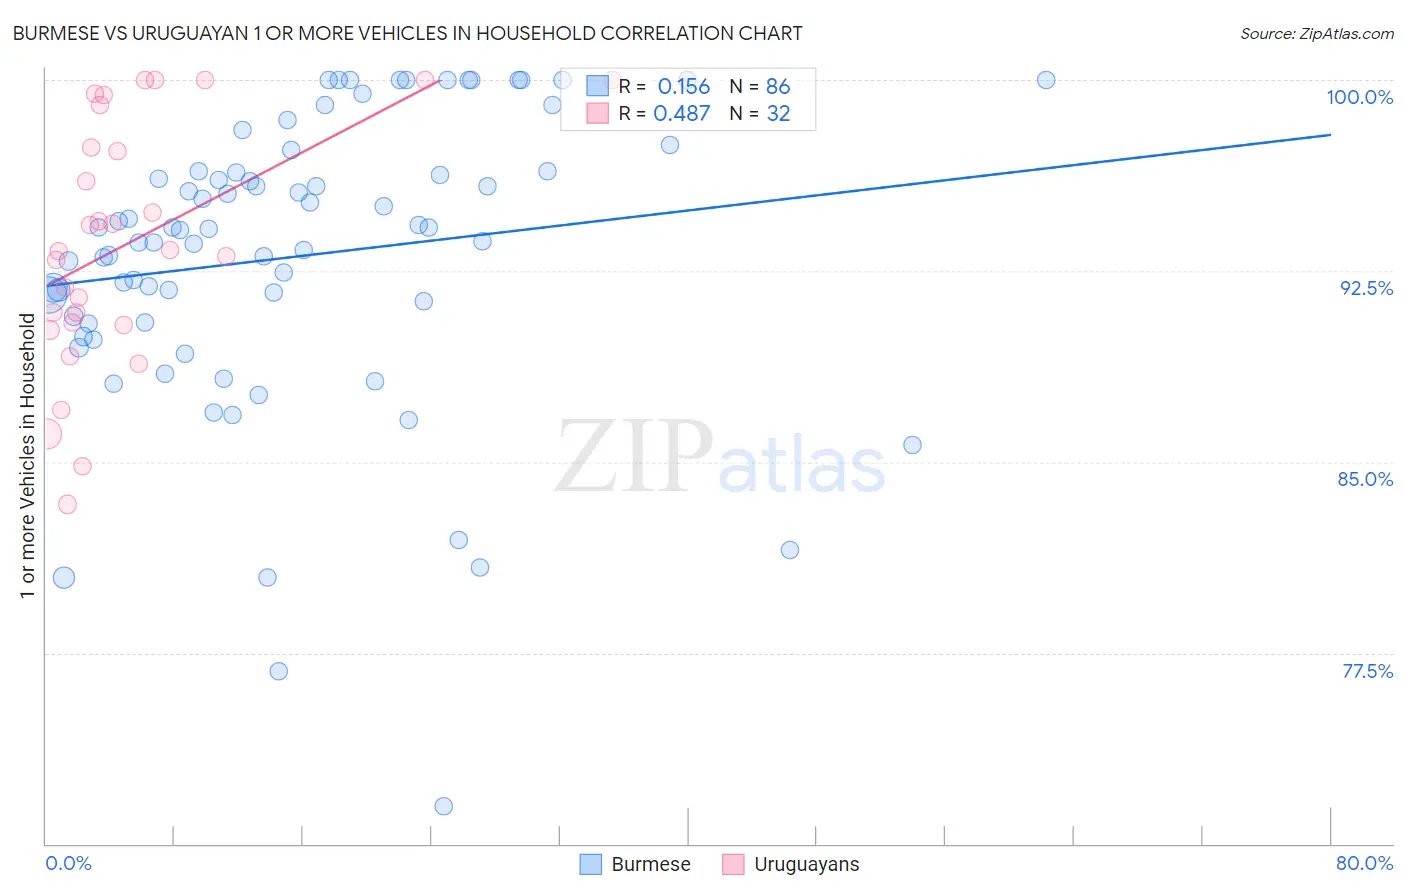
The statistical analysis conducted on geographies consisting of 464,980,772 people shows a poor positive correlation between the proportion of Burmese and percentage of households with 1 or more vehicles available in the United States with a correlation coefficient (R) of 0.156 and weighted average of 90.4%. Similarly, the statistical analysis conducted on geographies consisting of 144,759,773 people shows a moderate positive correlation between the proportion of Uruguayans and percentage of households with 1 or more vehicles available in the United States with a correlation coefficient (R) of 0.487 and weighted average of 88.8%, a difference of 1.8%.
1 or more Vehicles in Household Correlation Summary
| Measurement | Burmese | Uruguayan |
| Minimum | 71.5% | 83.3% |
| Maximum | 100.0% | 100.0% |
| Range | 28.5% | 16.7% |
| Mean | 93.1% | 93.6% |
| Median | 94.1% | 93.3% |
| Interquartile 25% (IQ1) | 90.5% | 90.4% |
| Interquartile 75% (IQ3) | 96.4% | 98.2% |
| Interquartile Range (IQR) | 5.9% | 7.7% |
| Standard Deviation (Sample) | 5.7% | 4.8% |
| Standard Deviation (Population) | 5.7% | 4.7% |
Similar Demographics by 1 or more Vehicles in Household
Demographics Similar to Burmese by 1 or more Vehicles in Household
In terms of 1 or more vehicles in household, the demographic groups most similar to Burmese are Immigrants from the Azores (90.4%, a difference of 0.0%), Immigrants from Cameroon (90.4%, a difference of 0.010%), Marshallese (90.4%, a difference of 0.010%), Nicaraguan (90.4%, a difference of 0.010%), and Immigrants from Kenya (90.4%, a difference of 0.020%).
| Demographics | Rating | Rank | 1 or more Vehicles in Household |
| Icelanders | 92.1 /100 | #121 | Exceptional 90.5% |
| Costa Ricans | 92.0 /100 | #122 | Exceptional 90.5% |
| Fijians | 91.8 /100 | #123 | Exceptional 90.5% |
| Puget Sound Salish | 91.5 /100 | #124 | Exceptional 90.5% |
| Immigrants | Korea | 90.5 /100 | #125 | Exceptional 90.5% |
| Immigrants | Cameroon | 89.4 /100 | #126 | Excellent 90.4% |
| Immigrants | Azores | 89.1 /100 | #127 | Excellent 90.4% |
| Burmese | 89.0 /100 | #128 | Excellent 90.4% |
| Marshallese | 88.9 /100 | #129 | Excellent 90.4% |
| Nicaraguans | 88.8 /100 | #130 | Excellent 90.4% |
| Immigrants | Kenya | 88.5 /100 | #131 | Excellent 90.4% |
| Immigrants | South Africa | 88.1 /100 | #132 | Excellent 90.4% |
| Immigrants | Syria | 87.5 /100 | #133 | Excellent 90.4% |
| Kenyans | 87.0 /100 | #134 | Excellent 90.4% |
| Immigrants | Oceania | 86.9 /100 | #135 | Excellent 90.4% |
Demographics Similar to Uruguayans by 1 or more Vehicles in Household
In terms of 1 or more vehicles in household, the demographic groups most similar to Uruguayans are Immigrants from South America (88.8%, a difference of 0.0%), Peruvian (88.8%, a difference of 0.050%), Immigrants from Hong Kong (88.7%, a difference of 0.050%), Cree (88.7%, a difference of 0.060%), and Immigrants from Zaire (88.8%, a difference of 0.070%).
| Demographics | Rating | Rank | 1 or more Vehicles in Household |
| Immigrants | Sri Lanka | 10.2 /100 | #215 | Poor 88.9% |
| Immigrants | Argentina | 9.4 /100 | #216 | Tragic 88.9% |
| Argentineans | 8.8 /100 | #217 | Tragic 88.9% |
| Ugandans | 8.7 /100 | #218 | Tragic 88.9% |
| Immigrants | Guatemala | 8.6 /100 | #219 | Tragic 88.9% |
| Immigrants | Zaire | 8.1 /100 | #220 | Tragic 88.8% |
| Peruvians | 7.9 /100 | #221 | Tragic 88.8% |
| Uruguayans | 7.0 /100 | #222 | Tragic 88.8% |
| Immigrants | South America | 7.0 /100 | #223 | Tragic 88.8% |
| Immigrants | Hong Kong | 6.2 /100 | #224 | Tragic 88.7% |
| Cree | 6.0 /100 | #225 | Tragic 88.7% |
| Cheyenne | 5.7 /100 | #226 | Tragic 88.7% |
| Ute | 5.6 /100 | #227 | Tragic 88.7% |
| Immigrants | Norway | 5.5 /100 | #228 | Tragic 88.7% |
| Immigrants | Romania | 5.4 /100 | #229 | Tragic 88.7% |