Immigrants from North Macedonia vs Immigrants from Albania 4 or more Vehicles in Household
COMPARE
Immigrants from North Macedonia
Immigrants from Albania
4 or more Vehicles in Household
4 or more Vehicles in Household Comparison
Immigrants from North Macedonia
Immigrants from Albania
5.7%
4 OR MORE VEHICLES IN HOUSEHOLD
2.5/ 100
METRIC RATING
246th/ 347
METRIC RANK
4.1%
4 OR MORE VEHICLES IN HOUSEHOLD
0.0/ 100
METRIC RATING
333rd/ 347
METRIC RANK
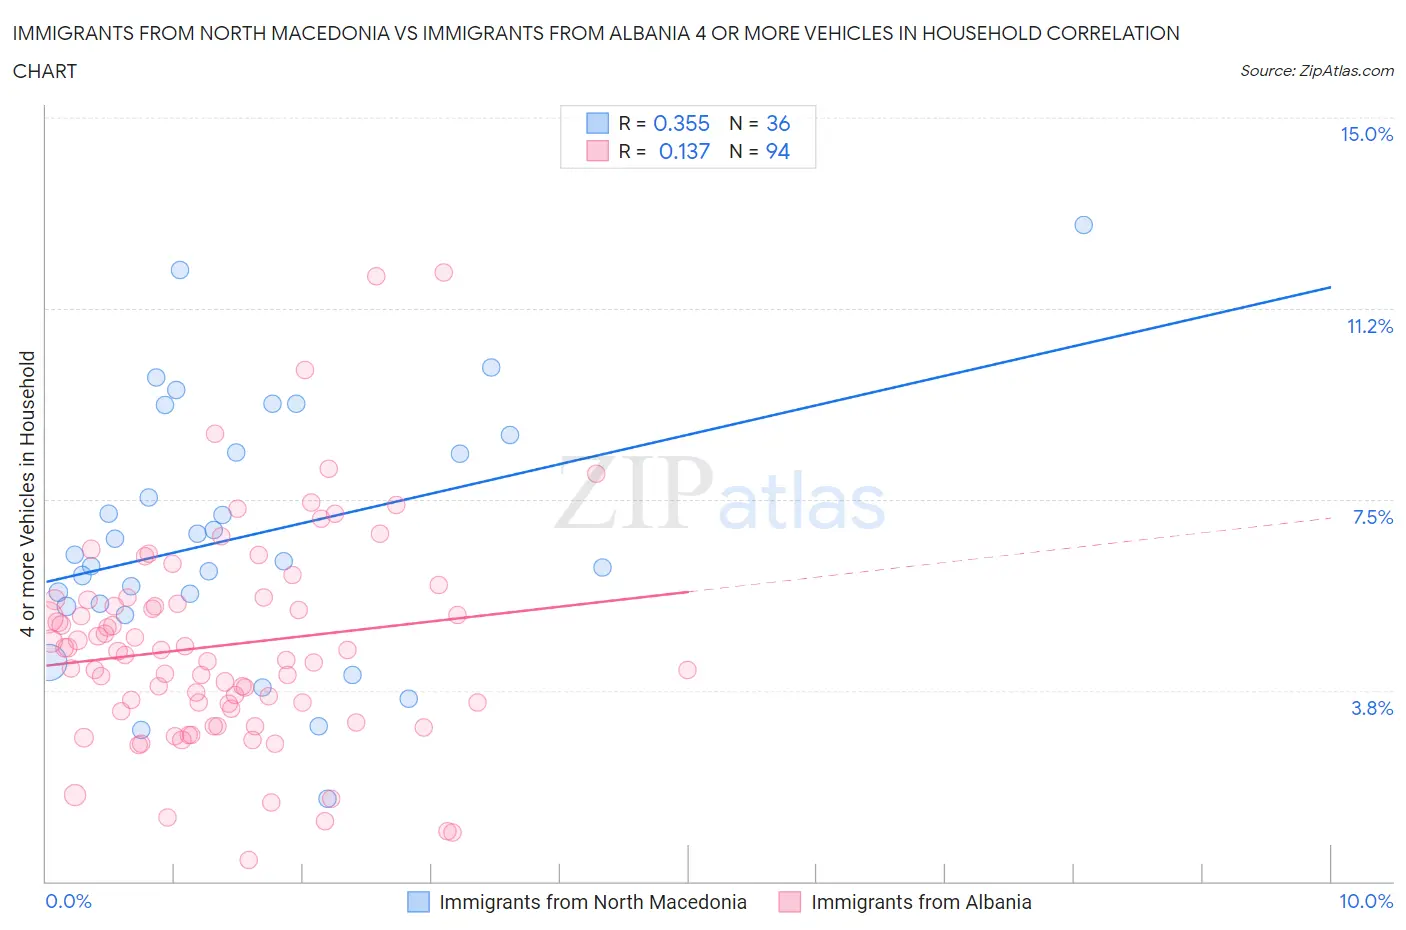
Immigrants from North Macedonia vs Immigrants from Albania 4 or more Vehicles in Household Correlation Chart
The statistical analysis conducted on geographies consisting of 74,089,047 people shows a mild positive correlation between the proportion of Immigrants from North Macedonia and percentage of households with 4 or more vehicles available in the United States with a correlation coefficient (R) of 0.355 and weighted average of 5.7%. Similarly, the statistical analysis conducted on geographies consisting of 118,698,484 people shows a poor positive correlation between the proportion of Immigrants from Albania and percentage of households with 4 or more vehicles available in the United States with a correlation coefficient (R) of 0.137 and weighted average of 4.1%, a difference of 39.4%.
4 or more Vehicles in Household Correlation Summary
| Measurement | Immigrants from North Macedonia | Immigrants from Albania |
| Minimum | 1.6% | 0.42% |
| Maximum | 12.9% | 12.0% |
| Range | 11.3% | 11.5% |
| Mean | 6.8% | 4.6% |
| Median | 6.3% | 4.5% |
| Interquartile 25% (IQ1) | 5.4% | 3.4% |
| Interquartile 75% (IQ3) | 8.6% | 5.5% |
| Interquartile Range (IQR) | 3.2% | 2.1% |
| Standard Deviation (Sample) | 2.5% | 2.1% |
| Standard Deviation (Population) | 2.5% | 2.1% |
Similar Demographics by 4 or more Vehicles in Household
Demographics Similar to Immigrants from North Macedonia by 4 or more Vehicles in Household
In terms of 4 or more vehicles in household, the demographic groups most similar to Immigrants from North Macedonia are Immigrants from Ethiopia (5.7%, a difference of 0.030%), Immigrants from Eastern Africa (5.7%, a difference of 0.14%), Immigrants from Southern Europe (5.7%, a difference of 0.16%), Immigrants from Europe (5.7%, a difference of 0.26%), and Ugandan (5.7%, a difference of 0.28%).
| Demographics | Rating | Rank | 4 or more Vehicles in Household |
| Immigrants | Australia | 3.8 /100 | #239 | Tragic 5.8% |
| Immigrants | Poland | 3.8 /100 | #240 | Tragic 5.8% |
| Mongolians | 3.7 /100 | #241 | Tragic 5.8% |
| Immigrants | Middle Africa | 3.4 /100 | #242 | Tragic 5.8% |
| Immigrants | Czechoslovakia | 3.2 /100 | #243 | Tragic 5.8% |
| Ethiopians | 3.2 /100 | #244 | Tragic 5.8% |
| Bulgarians | 3.1 /100 | #245 | Tragic 5.8% |
| Immigrants | North Macedonia | 2.5 /100 | #246 | Tragic 5.7% |
| Immigrants | Ethiopia | 2.4 /100 | #247 | Tragic 5.7% |
| Immigrants | Eastern Africa | 2.4 /100 | #248 | Tragic 5.7% |
| Immigrants | Southern Europe | 2.3 /100 | #249 | Tragic 5.7% |
| Immigrants | Europe | 2.3 /100 | #250 | Tragic 5.7% |
| Ugandans | 2.2 /100 | #251 | Tragic 5.7% |
| Sub-Saharan Africans | 2.1 /100 | #252 | Tragic 5.7% |
| Immigrants | Cuba | 1.6 /100 | #253 | Tragic 5.7% |
Demographics Similar to Immigrants from Albania by 4 or more Vehicles in Household
In terms of 4 or more vehicles in household, the demographic groups most similar to Immigrants from Albania are Immigrants from Trinidad and Tobago (4.1%, a difference of 0.21%), Immigrants from Dominica (4.2%, a difference of 1.7%), West Indian (4.2%, a difference of 2.6%), Immigrants from Ecuador (4.2%, a difference of 2.9%), and Immigrants from Senegal (4.2%, a difference of 3.1%).
| Demographics | Rating | Rank | 4 or more Vehicles in Household |
| Cape Verdeans | 0.0 /100 | #326 | Tragic 4.4% |
| Senegalese | 0.0 /100 | #327 | Tragic 4.3% |
| Trinidadians and Tobagonians | 0.0 /100 | #328 | Tragic 4.3% |
| Immigrants | Senegal | 0.0 /100 | #329 | Tragic 4.2% |
| Immigrants | Ecuador | 0.0 /100 | #330 | Tragic 4.2% |
| West Indians | 0.0 /100 | #331 | Tragic 4.2% |
| Immigrants | Dominica | 0.0 /100 | #332 | Tragic 4.2% |
| Immigrants | Albania | 0.0 /100 | #333 | Tragic 4.1% |
| Immigrants | Trinidad and Tobago | 0.0 /100 | #334 | Tragic 4.1% |
| Barbadians | 0.0 /100 | #335 | Tragic 3.9% |
| Immigrants | Bangladesh | 0.0 /100 | #336 | Tragic 3.9% |
| Vietnamese | 0.0 /100 | #337 | Tragic 3.9% |
| Immigrants | Cabo Verde | 0.0 /100 | #338 | Tragic 3.8% |
| Immigrants | Uzbekistan | 0.0 /100 | #339 | Tragic 3.6% |
| Immigrants | Barbados | 0.0 /100 | #340 | Tragic 3.6% |