Immigrants from North Macedonia vs Black/African American Seniors Poverty Over the Age of 65
COMPARE
Immigrants from North Macedonia
Black/African American
Seniors Poverty Over the Age of 65
Seniors Poverty Over the Age of 65 Comparison
Immigrants from North Macedonia
Blacks/African Americans
9.6%
SENIORS POVERTY OVER THE AGE OF 65
99.6/ 100
METRIC RATING
41st/ 347
METRIC RANK
13.7%
SENIORS POVERTY OVER THE AGE OF 65
0.0/ 100
METRIC RATING
291st/ 347
METRIC RANK
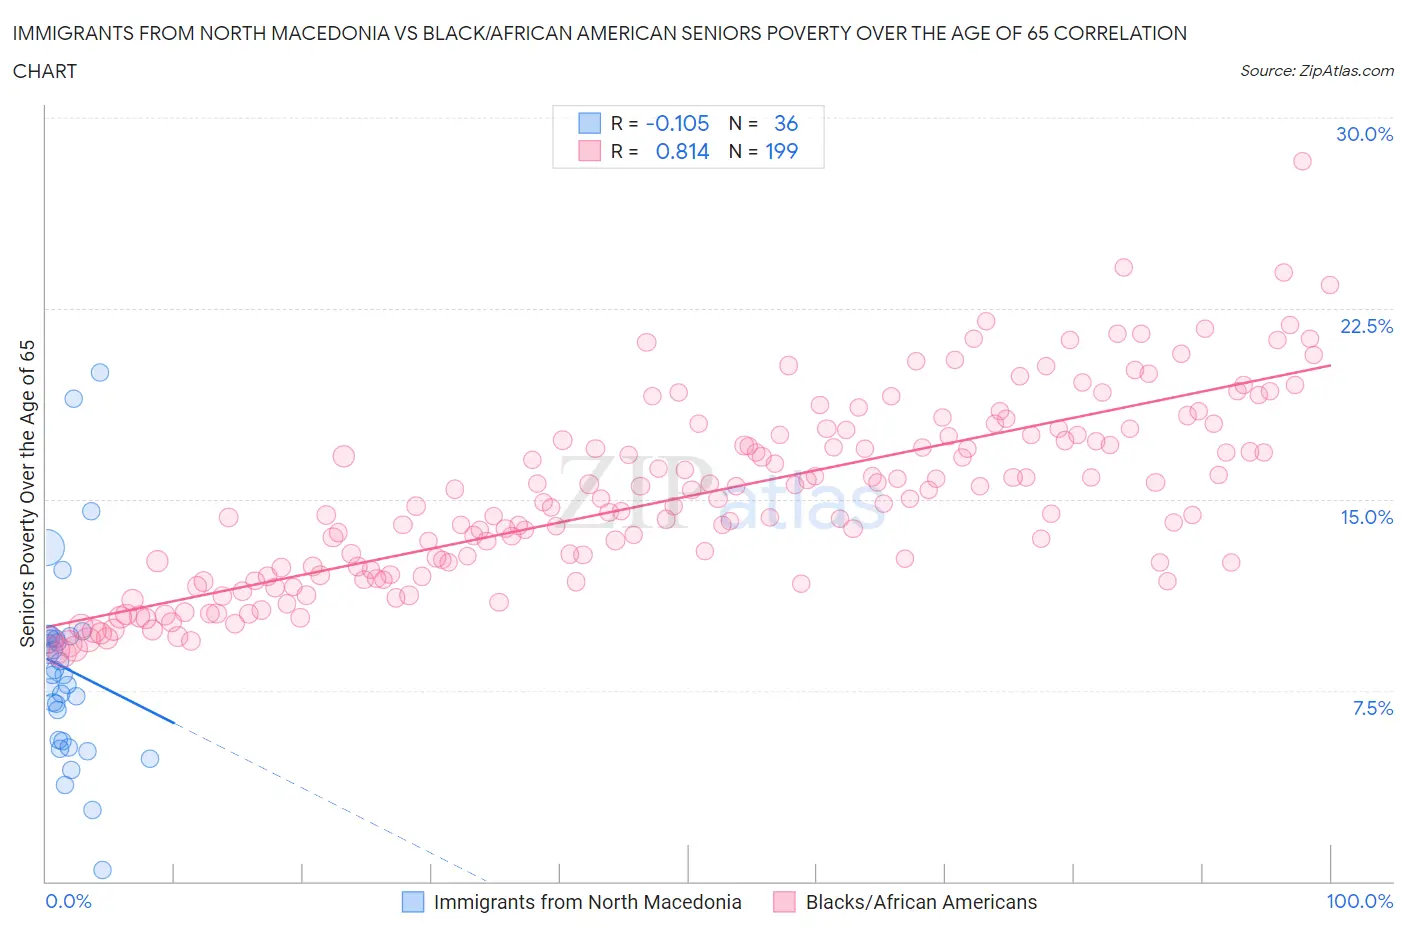
Immigrants from North Macedonia vs Black/African American Seniors Poverty Over the Age of 65 Correlation Chart
The statistical analysis conducted on geographies consisting of 74,265,150 people shows a poor negative correlation between the proportion of Immigrants from North Macedonia and poverty level among seniors over the age of 65 in the United States with a correlation coefficient (R) of -0.105 and weighted average of 9.6%. Similarly, the statistical analysis conducted on geographies consisting of 561,317,692 people shows a very strong positive correlation between the proportion of Blacks/African Americans and poverty level among seniors over the age of 65 in the United States with a correlation coefficient (R) of 0.814 and weighted average of 13.7%, a difference of 42.8%.
Seniors Poverty Over the Age of 65 Correlation Summary
| Measurement | Immigrants from North Macedonia | Black/African American |
| Minimum | 0.44% | 9.0% |
| Maximum | 20.0% | 28.3% |
| Range | 19.6% | 19.3% |
| Mean | 8.3% | 15.1% |
| Median | 8.1% | 14.8% |
| Interquartile 25% (IQ1) | 5.5% | 12.0% |
| Interquartile 75% (IQ3) | 9.6% | 17.5% |
| Interquartile Range (IQR) | 4.1% | 5.5% |
| Standard Deviation (Sample) | 3.9% | 3.6% |
| Standard Deviation (Population) | 3.9% | 3.6% |
Similar Demographics by Seniors Poverty Over the Age of 65
Demographics Similar to Immigrants from North Macedonia by Seniors Poverty Over the Age of 65
In terms of seniors poverty over the age of 65, the demographic groups most similar to Immigrants from North Macedonia are Zimbabwean (9.6%, a difference of 0.15%), Assyrian/Chaldean/Syriac (9.6%, a difference of 0.16%), Eastern European (9.6%, a difference of 0.26%), Greek (9.6%, a difference of 0.28%), and Austrian (9.6%, a difference of 0.35%).
| Demographics | Rating | Rank | Seniors Poverty Over the Age of 65 |
| British | 99.8 /100 | #34 | Exceptional 9.4% |
| Latvians | 99.8 /100 | #35 | Exceptional 9.5% |
| Czechoslovakians | 99.8 /100 | #36 | Exceptional 9.5% |
| Scotch-Irish | 99.7 /100 | #37 | Exceptional 9.5% |
| Belgians | 99.7 /100 | #38 | Exceptional 9.5% |
| Greeks | 99.6 /100 | #39 | Exceptional 9.6% |
| Assyrians/Chaldeans/Syriacs | 99.6 /100 | #40 | Exceptional 9.6% |
| Immigrants | North Macedonia | 99.6 /100 | #41 | Exceptional 9.6% |
| Zimbabweans | 99.6 /100 | #42 | Exceptional 9.6% |
| Eastern Europeans | 99.6 /100 | #43 | Exceptional 9.6% |
| Austrians | 99.5 /100 | #44 | Exceptional 9.6% |
| Estonians | 99.5 /100 | #45 | Exceptional 9.6% |
| Immigrants | Taiwan | 99.5 /100 | #46 | Exceptional 9.7% |
| Immigrants | South Central Asia | 99.5 /100 | #47 | Exceptional 9.7% |
| French | 99.5 /100 | #48 | Exceptional 9.7% |
Demographics Similar to Blacks/African Americans by Seniors Poverty Over the Age of 65
In terms of seniors poverty over the age of 65, the demographic groups most similar to Blacks/African Americans are Jamaican (13.6%, a difference of 0.46%), Immigrants from Central America (13.6%, a difference of 0.46%), Spanish American Indian (13.8%, a difference of 0.69%), Belizean (13.6%, a difference of 0.73%), and Immigrants from Mexico (13.6%, a difference of 0.87%).
| Demographics | Rating | Rank | Seniors Poverty Over the Age of 65 |
| Colville | 0.0 /100 | #284 | Tragic 13.5% |
| Guatemalans | 0.0 /100 | #285 | Tragic 13.5% |
| Immigrants | Senegal | 0.0 /100 | #286 | Tragic 13.6% |
| Immigrants | Mexico | 0.0 /100 | #287 | Tragic 13.6% |
| Belizeans | 0.0 /100 | #288 | Tragic 13.6% |
| Jamaicans | 0.0 /100 | #289 | Tragic 13.6% |
| Immigrants | Central America | 0.0 /100 | #290 | Tragic 13.6% |
| Blacks/African Americans | 0.0 /100 | #291 | Tragic 13.7% |
| Spanish American Indians | 0.0 /100 | #292 | Tragic 13.8% |
| Immigrants | Guatemala | 0.0 /100 | #293 | Tragic 13.8% |
| Cheyenne | 0.0 /100 | #294 | Tragic 13.9% |
| Apache | 0.0 /100 | #295 | Tragic 13.9% |
| Immigrants | Jamaica | 0.0 /100 | #296 | Tragic 13.9% |
| Vietnamese | 0.0 /100 | #297 | Tragic 14.0% |
| Immigrants | Belize | 0.0 /100 | #298 | Tragic 14.0% |