Immigrants from North Macedonia vs Black/African American Disability Age 65 to 74
COMPARE
Immigrants from North Macedonia
Black/African American
Disability Age 65 to 74
Disability Age 65 to 74 Comparison
Immigrants from North Macedonia
Blacks/African Americans
21.6%
DISABILITY AGE 65 TO 74
99.5/ 100
METRIC RATING
60th/ 347
METRIC RANK
27.3%
DISABILITY AGE 65 TO 74
0.0/ 100
METRIC RATING
306th/ 347
METRIC RANK
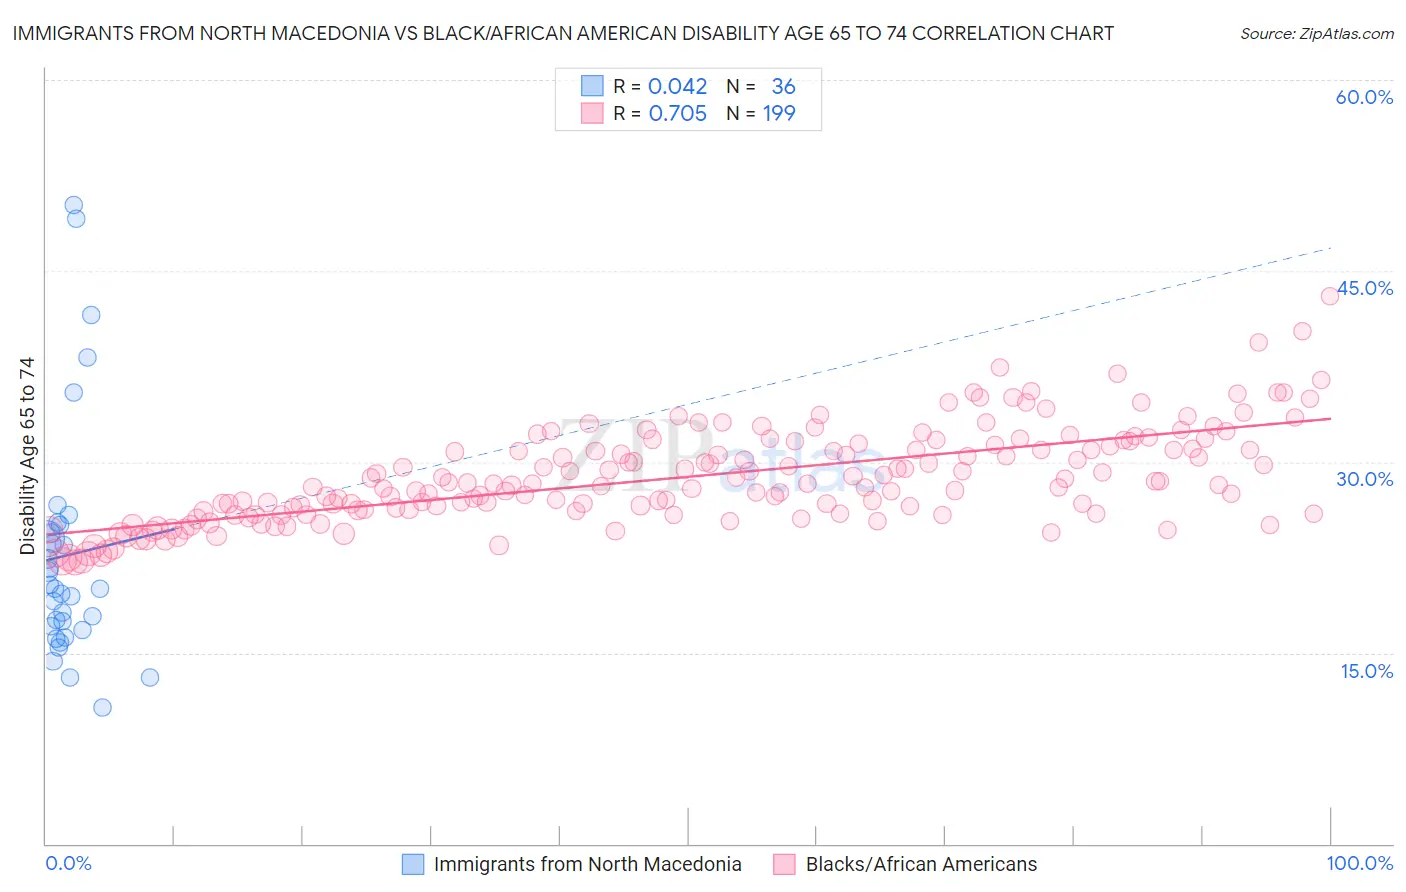
Immigrants from North Macedonia vs Black/African American Disability Age 65 to 74 Correlation Chart
The statistical analysis conducted on geographies consisting of 74,295,345 people shows no correlation between the proportion of Immigrants from North Macedonia and percentage of population with a disability between the ages 65 and 75 in the United States with a correlation coefficient (R) of 0.042 and weighted average of 21.6%. Similarly, the statistical analysis conducted on geographies consisting of 563,649,388 people shows a strong positive correlation between the proportion of Blacks/African Americans and percentage of population with a disability between the ages 65 and 75 in the United States with a correlation coefficient (R) of 0.705 and weighted average of 27.3%, a difference of 26.6%.
Disability Age 65 to 74 Correlation Summary
| Measurement | Immigrants from North Macedonia | Black/African American |
| Minimum | 10.7% | 22.1% |
| Maximum | 50.2% | 43.0% |
| Range | 39.5% | 20.9% |
| Mean | 22.7% | 28.8% |
| Median | 20.0% | 28.2% |
| Interquartile 25% (IQ1) | 16.9% | 26.1% |
| Interquartile 75% (IQ3) | 24.7% | 31.3% |
| Interquartile Range (IQR) | 7.8% | 5.2% |
| Standard Deviation (Sample) | 9.3% | 3.7% |
| Standard Deviation (Population) | 9.2% | 3.7% |
Similar Demographics by Disability Age 65 to 74
Demographics Similar to Immigrants from North Macedonia by Disability Age 65 to 74
In terms of disability age 65 to 74, the demographic groups most similar to Immigrants from North Macedonia are Zimbabwean (21.5%, a difference of 0.030%), Egyptian (21.6%, a difference of 0.030%), Carpatho Rusyn (21.6%, a difference of 0.050%), Immigrants from Pakistan (21.5%, a difference of 0.060%), and Immigrants from Asia (21.5%, a difference of 0.10%).
| Demographics | Rating | Rank | Disability Age 65 to 74 |
| Bhutanese | 99.6 /100 | #53 | Exceptional 21.5% |
| Immigrants | Italy | 99.6 /100 | #54 | Exceptional 21.5% |
| Immigrants | Romania | 99.5 /100 | #55 | Exceptional 21.5% |
| Immigrants | Denmark | 99.5 /100 | #56 | Exceptional 21.5% |
| Immigrants | Asia | 99.5 /100 | #57 | Exceptional 21.5% |
| Immigrants | Pakistan | 99.5 /100 | #58 | Exceptional 21.5% |
| Zimbabweans | 99.5 /100 | #59 | Exceptional 21.5% |
| Immigrants | North Macedonia | 99.5 /100 | #60 | Exceptional 21.6% |
| Egyptians | 99.5 /100 | #61 | Exceptional 21.6% |
| Carpatho Rusyns | 99.5 /100 | #62 | Exceptional 21.6% |
| Immigrants | Europe | 99.4 /100 | #63 | Exceptional 21.6% |
| Immigrants | Latvia | 99.4 /100 | #64 | Exceptional 21.6% |
| Immigrants | Russia | 99.4 /100 | #65 | Exceptional 21.6% |
| Maltese | 99.4 /100 | #66 | Exceptional 21.6% |
| Immigrants | South Africa | 99.3 /100 | #67 | Exceptional 21.7% |
Demographics Similar to Blacks/African Americans by Disability Age 65 to 74
In terms of disability age 65 to 74, the demographic groups most similar to Blacks/African Americans are Ute (27.3%, a difference of 0.060%), Sioux (27.3%, a difference of 0.21%), Yaqui (27.4%, a difference of 0.27%), Shoshone (27.4%, a difference of 0.32%), and Mexican (27.2%, a difference of 0.40%).
| Demographics | Rating | Rank | Disability Age 65 to 74 |
| Potawatomi | 0.0 /100 | #299 | Tragic 27.0% |
| Immigrants | Dominican Republic | 0.0 /100 | #300 | Tragic 27.0% |
| Immigrants | Mexico | 0.0 /100 | #301 | Tragic 27.1% |
| Central American Indians | 0.0 /100 | #302 | Tragic 27.1% |
| Tlingit-Haida | 0.0 /100 | #303 | Tragic 27.1% |
| Puget Sound Salish | 0.0 /100 | #304 | Tragic 27.2% |
| Mexicans | 0.0 /100 | #305 | Tragic 27.2% |
| Blacks/African Americans | 0.0 /100 | #306 | Tragic 27.3% |
| Ute | 0.0 /100 | #307 | Tragic 27.3% |
| Sioux | 0.0 /100 | #308 | Tragic 27.3% |
| Yaqui | 0.0 /100 | #309 | Tragic 27.4% |
| Shoshone | 0.0 /100 | #310 | Tragic 27.4% |
| Menominee | 0.0 /100 | #311 | Tragic 27.4% |
| Osage | 0.0 /100 | #312 | Tragic 27.5% |
| Paiute | 0.0 /100 | #313 | Tragic 27.8% |