Immigrants from Ghana vs Black/African American No Vehicles in Household
COMPARE
Immigrants from Ghana
Black/African American
No Vehicles in Household
No Vehicles in Household Comparison
Immigrants from Ghana
Blacks/African Americans
16.6%
NO VEHICLES IN HOUSEHOLD
0.0/ 100
METRIC RATING
317th/ 347
METRIC RANK
11.9%
NO VEHICLES IN HOUSEHOLD
1.6/ 100
METRIC RATING
251st/ 347
METRIC RANK
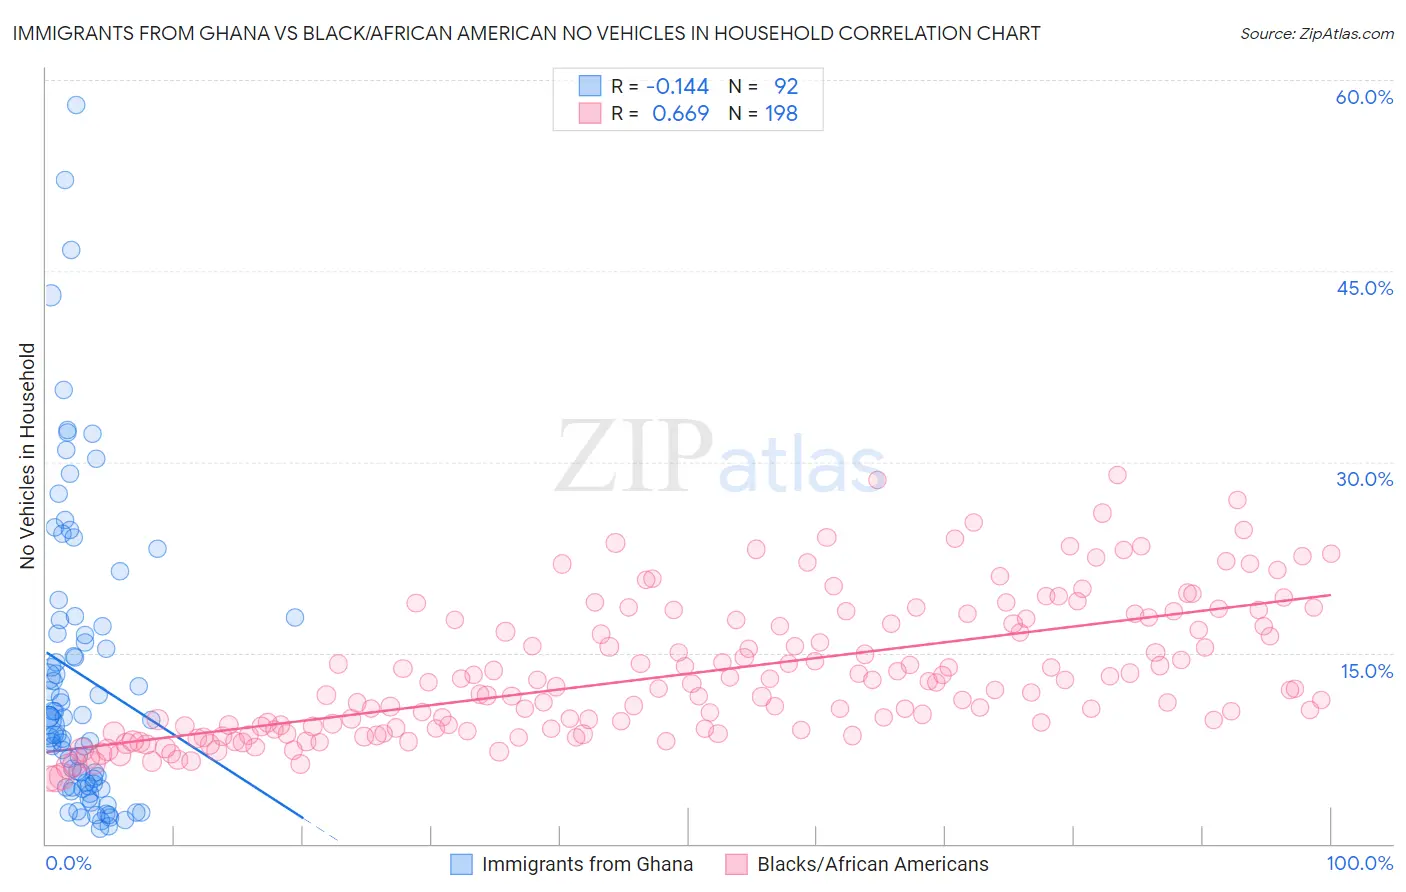
Immigrants from Ghana vs Black/African American No Vehicles in Household Correlation Chart
The statistical analysis conducted on geographies consisting of 199,471,025 people shows a poor negative correlation between the proportion of Immigrants from Ghana and percentage of households with no vehicle available in the United States with a correlation coefficient (R) of -0.144 and weighted average of 16.6%. Similarly, the statistical analysis conducted on geographies consisting of 549,724,013 people shows a significant positive correlation between the proportion of Blacks/African Americans and percentage of households with no vehicle available in the United States with a correlation coefficient (R) of 0.669 and weighted average of 11.9%, a difference of 40.0%.
No Vehicles in Household Correlation Summary
| Measurement | Immigrants from Ghana | Black/African American |
| Minimum | 1.2% | 5.1% |
| Maximum | 58.0% | 29.0% |
| Range | 56.8% | 23.8% |
| Mean | 13.3% | 13.4% |
| Median | 9.8% | 12.2% |
| Interquartile 25% (IQ1) | 4.6% | 9.1% |
| Interquartile 75% (IQ3) | 17.3% | 17.3% |
| Interquartile Range (IQR) | 12.7% | 8.2% |
| Standard Deviation (Sample) | 11.8% | 5.4% |
| Standard Deviation (Population) | 11.7% | 5.3% |
Similar Demographics by No Vehicles in Household
Demographics Similar to Immigrants from Ghana by No Vehicles in Household
In terms of no vehicles in household, the demographic groups most similar to Immigrants from Ghana are Immigrants from Belarus (16.7%, a difference of 0.86%), Ghanaian (16.4%, a difference of 0.95%), Alaska Native (17.4%, a difference of 4.8%), Soviet Union (17.4%, a difference of 5.0%), and Cypriot (15.7%, a difference of 6.0%).
| Demographics | Rating | Rank | No Vehicles in Household |
| Cape Verdeans | 0.0 /100 | #310 | Tragic 15.6% |
| Immigrants | Israel | 0.0 /100 | #311 | Tragic 15.6% |
| Alaskan Athabascans | 0.0 /100 | #312 | Tragic 15.6% |
| Tohono O'odham | 0.0 /100 | #313 | Tragic 15.6% |
| Albanians | 0.0 /100 | #314 | Tragic 15.6% |
| Cypriots | 0.0 /100 | #315 | Tragic 15.7% |
| Ghanaians | 0.0 /100 | #316 | Tragic 16.4% |
| Immigrants | Ghana | 0.0 /100 | #317 | Tragic 16.6% |
| Immigrants | Belarus | 0.0 /100 | #318 | Tragic 16.7% |
| Alaska Natives | 0.0 /100 | #319 | Tragic 17.4% |
| Soviet Union | 0.0 /100 | #320 | Tragic 17.4% |
| Jamaicans | 0.0 /100 | #321 | Tragic 17.9% |
| Immigrants | Cabo Verde | 0.0 /100 | #322 | Tragic 18.4% |
| Immigrants | Yemen | 0.0 /100 | #323 | Tragic 19.5% |
| Immigrants | Caribbean | 0.0 /100 | #324 | Tragic 19.6% |
Demographics Similar to Blacks/African Americans by No Vehicles in Household
In terms of no vehicles in household, the demographic groups most similar to Blacks/African Americans are Immigrants from Serbia (11.9%, a difference of 0.25%), Egyptian (11.9%, a difference of 0.32%), Paiute (11.8%, a difference of 0.35%), Immigrants from Nigeria (11.8%, a difference of 0.57%), and Immigrants from Belgium (11.8%, a difference of 0.60%).
| Demographics | Rating | Rank | No Vehicles in Household |
| Immigrants | Portugal | 2.2 /100 | #244 | Tragic 11.7% |
| Immigrants | Honduras | 2.1 /100 | #245 | Tragic 11.8% |
| Menominee | 2.0 /100 | #246 | Tragic 11.8% |
| Immigrants | Czechoslovakia | 2.0 /100 | #247 | Tragic 11.8% |
| Immigrants | Belgium | 1.9 /100 | #248 | Tragic 11.8% |
| Immigrants | Nigeria | 1.9 /100 | #249 | Tragic 11.8% |
| Paiute | 1.8 /100 | #250 | Tragic 11.8% |
| Blacks/African Americans | 1.6 /100 | #251 | Tragic 11.9% |
| Immigrants | Serbia | 1.5 /100 | #252 | Tragic 11.9% |
| Egyptians | 1.4 /100 | #253 | Tragic 11.9% |
| Immigrants | Uruguay | 1.3 /100 | #254 | Tragic 11.9% |
| Hondurans | 1.2 /100 | #255 | Tragic 12.0% |
| Liberians | 1.2 /100 | #256 | Tragic 12.0% |
| Nigerians | 0.9 /100 | #257 | Tragic 12.1% |
| South American Indians | 0.9 /100 | #258 | Tragic 12.1% |